2020-11-21 22:11 |
The ChainLink (LINK) price has broken out from the $13.10 resistance area and validated it as support afterwards. LINK is expected to continue increasing towards the next resistance area as outlined below.
The Upward Move Continues
The LINK price has been moving upwards since it broke out from a descending resistance line on Oct 5. The increase has been gradual. The price just broke out from the $13.10 resistance area, validated it as support, and continued its upward movement.
The next significant resistance areas come at Fib retracement levels, more specifically, the 0.618 and 0.786 levels at $15.64 and $17.86, respectively.
Technical indicators in the daily time-frame are bullish, pointing to a continued upward movement towards these two levels.
LINK Chart By TradingViewIt is worth noting that the weekly chart is still relatively bearish, showing that the price is clearly still retracing as a result of the Aug drop.
While the weekly RSI is still above 50, it has been decreasing significantly over the past two months. The MACD is also decreasing, having lost its entire momentum. The Stochastic Oscillator has just made a bearish cross.
Therefore, it’s likely that the current rally is a retracement in response to the prior drop rather than the beginning of a new upward movement.
LINK Chart By TradingView Future MovementThe short-term chart shows that LINK is trading inside a parallel ascending channel, and has been since Nov 4. At the time of writing, the price was trading right in the middle of this channel.
The most likely move that also fits with the long-term outline would be a breakout from the middle of the channel. This would increase towards the resistance line, which is currently between $16 and $17.
Both the MACD and the RSI are increasing, supporting the possibility of an upward move.
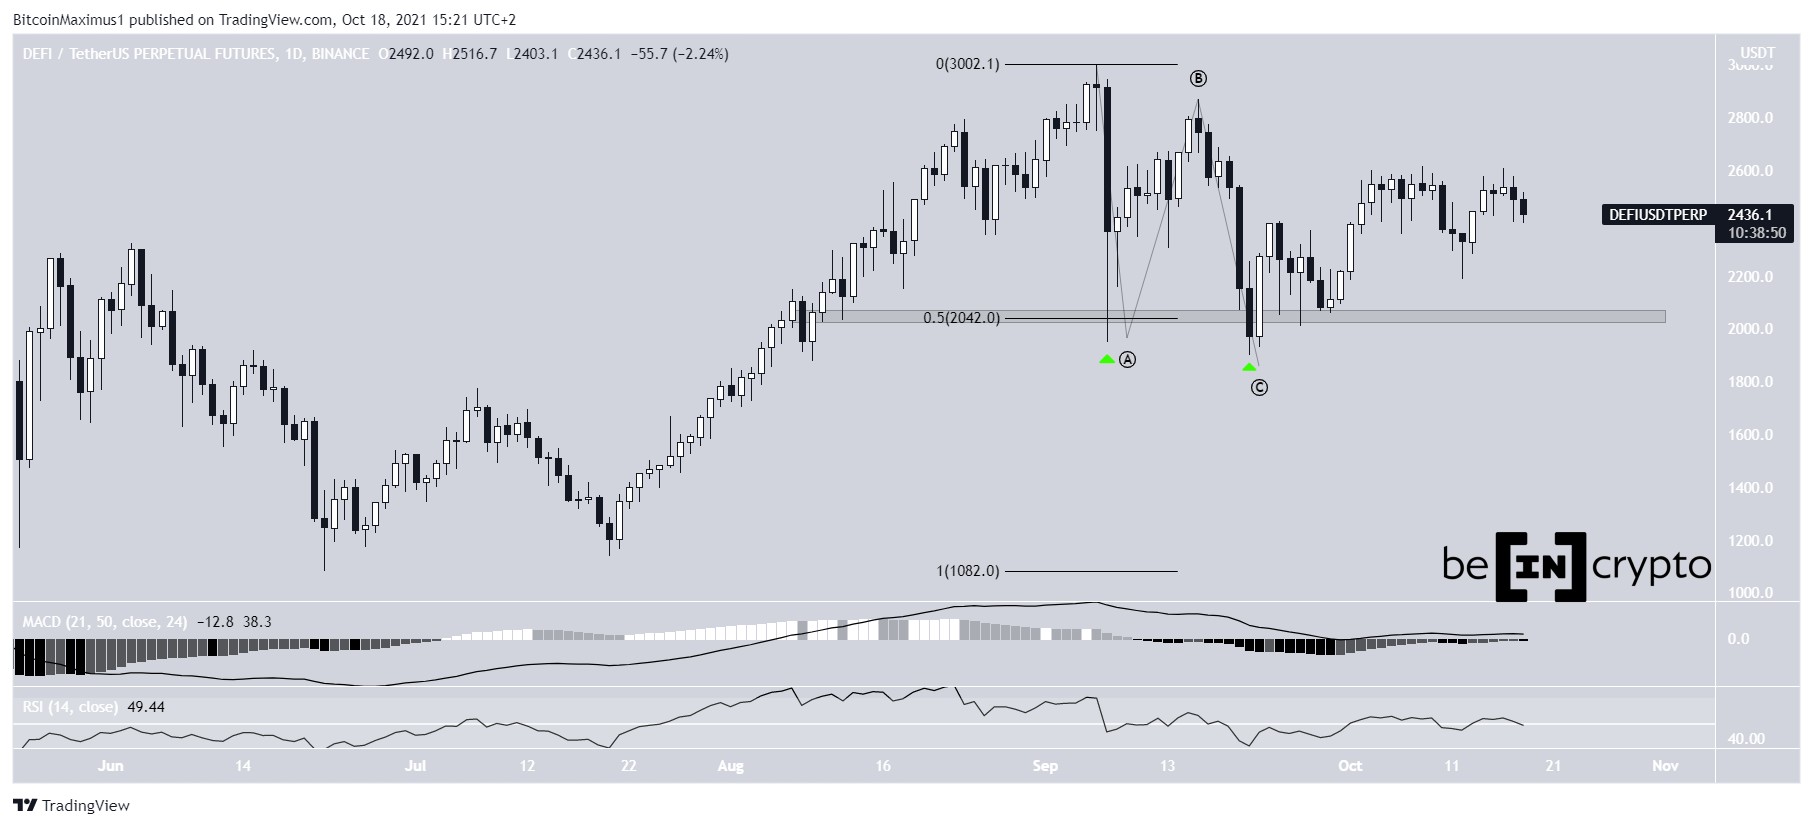
LINK Chart By TradingView Wave CountCryptocurrency trader @TheEWGuy outlined a LINK chart, stating that the price has one more final increase to complete towards $16, before beginning a long-term downward move.
Source: TwitterThe wave count since the Sept 23 low looks like an A-B-C corrective formation (shown in black below) in which the price is in the C wave.
The C wave is generated by a bullish impulse, in which the price is in the fifth and final sub-wave (blue), which would complete the overall correction.
Projecting the length of wave A to the bottom of B gives us a high of $15.40. This price coincides with the 0.618 Fib resistance level as outlined in the first section and makes it a likely high to be reached.
LINK Chart By TradingView ConclusionTo conclude, the LINK price is expected to increase towards at least $15.40, and it is probable that the current upward movement is corrective rather than the beginning of a new impulse.
For BeInCrypto’s previous Bitcoin analysis, click here!
Disclaimer: Cryptocurrency trading carries a high level of risk and may not be suitable for all investors. The views expressed in this article do not reflect those of BeInCrypto
The post LINK Continues Its Climb With Another Breakout appeared first on BeInCrypto.
origin »Bitcoin price in Telegram @btc_price_every_hour
ETH/LINK Price Action Candlestick Set (LINKETHPA) на Currencies.ru
|
|