2020-10-5 17:19 |
The Chainlink (LINK) price has broken out from a descending wedge and created a higher low.
While the price is expected to continue moving upwards towards $11, the reaction to the level will be crucial in determining the longer-term trend.
LINK Closes in on Resistance LineThe LINK price has been decreasing following a descending resistance line since Aug 17, when the price reached a high of $20.71. The decrease continued until Sept. 23, where LINK reached a local low of $7.28 and bounced.
The next day, the price created a bullish engulfing candlestick. This movement validated the 200-day moving average (MA) and the $7.50 area as support.
Even though the price has been increasing since then, it has been rejected by the $11 area, which previously acted as support and has now turned resistance. Furthermore, the price has yet to reach the aforementioned descending resistance line drawn since the Aug 17 high.
LINK Chart By TradingView Technical Indicators Show IndecisionIn the daily time-frame, technical indicators are neutral, leaning on bullish. The MACD is increasing but has not yet turned positive, the Stochastic Oscillator has just made a bullish cross, but the RSI is below 50.
Therefore, we cannot confirm whether the price will break out or down.
LINK Chart By TradingViewThe shorter-term two-hour chart shows similar indecision.
On one hand, the price has bounced at the 0.618 FIb level of the entire increase, creating a higher low and allowing for the possibility of upwards continuation.
On the other, LINK looks to be getting rejected by the minor $9.60 resistance area and the MACD has begun to lose steam.
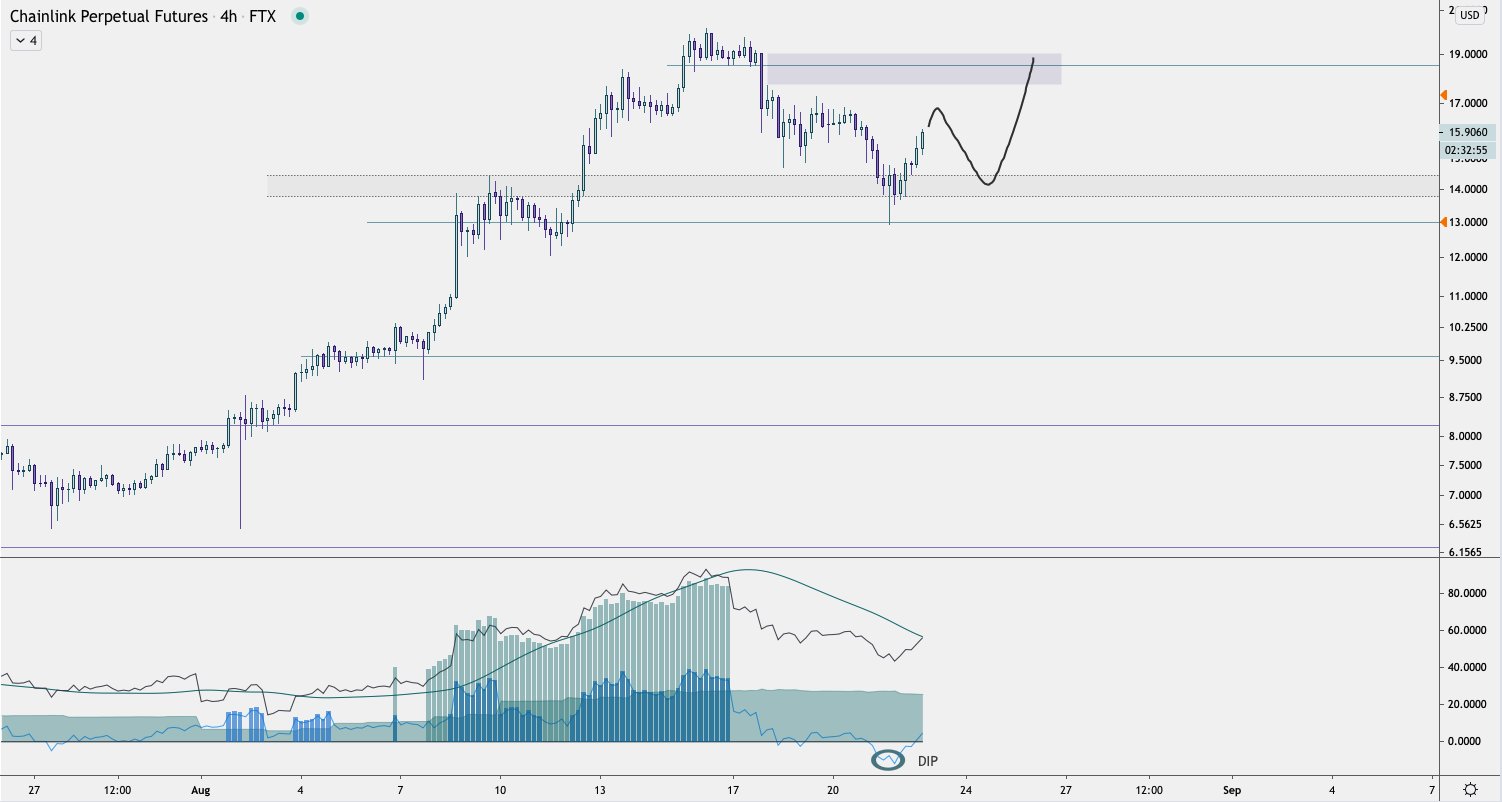
LINK Chart By TradingView Wave CountCryptocurrency trader @CryptoTony_ outlined a LINK chart, stating that LINK is likely on track to increase towards $12.
Source: TwitterSince the decrease began after the high of Aug 17, LINK seems to have completed a bearish impulse pattern that took the form of a leading diagonal (shown in black below). This could have been wave A of an A-B-C correction (in orange below), which would eventually lead to another lower low.
After completing the impulse, LINK broke out from the descending wedge on Sept 24 and is now increasing.
A customary correction would take the price back the 0.618 Fib level, found at $15.17 before resuming its downward movement.
LINK Chart By TradingViewA closer look at the correction shows an A-B-C formation, in which waves A and B might have already been completed. If so, an A:C ratio of 1:1.61 would take LINK right to the $15.10 area.
A decrease below the $8.78 low would invalidate this particular wave count.
LINK Chart By TradingViewFor BeInCrypto’s latest Bitcoin analysis, click here!
Disclaimer: Cryptocurrency trading carries a high level of risk, and may not be suitable for all investors. The views expressed in this article do not reflect those of BeInCrypto.
The post LINK Breaks Out, Creates Higher Low – Where to Next? appeared first on BeInCrypto.
origin »Bitcoin price in Telegram @btc_price_every_hour
ETH/LINK Price Action Candlestick Set (LINKETHPA) на Currencies.ru
|
|


