2020-4-24 23:15 |
The gold price has increased considerably since March 16, having recouped the entire losses from March 9-11. However, the rally has begun to show weakness in the form of several bearish divergences.
After the massive oil crash on April 20, questions on whether other commodities will follow suit and which will be the first to do so have been rampant. Twitter user @Russian_Market made an interesting prediction, stating that the oil price crash will be followed by a similar decrease in the price of gold.
“After oil crash we will see gold crash.”
Below, we will take a look at the gold price and see if it is likely to go down. We previously posted an analysis that compares the correlation of the BTC price and that of oil, so the current one will focus mainly on gold and BTC.
GoldThe gold price has recouped almost the entire losses resulting from the March 9-12 decrease, which was present in almost every market. After the decrease, the price reached the $1,450 support area, which has been offering support almost for the entirety of 2019.
The price reached a bottom of $1,451 on March 16 and has been increasing ever since. While the price has created several bullish engulfing candlesticks, it has shown some strong signs of weakness. There is a considerable bearish divergence developing in the three-day RSI in two separate instances. This suggests that the price is likely to go down in the near future, possibly validating the $1,450 support area once more.
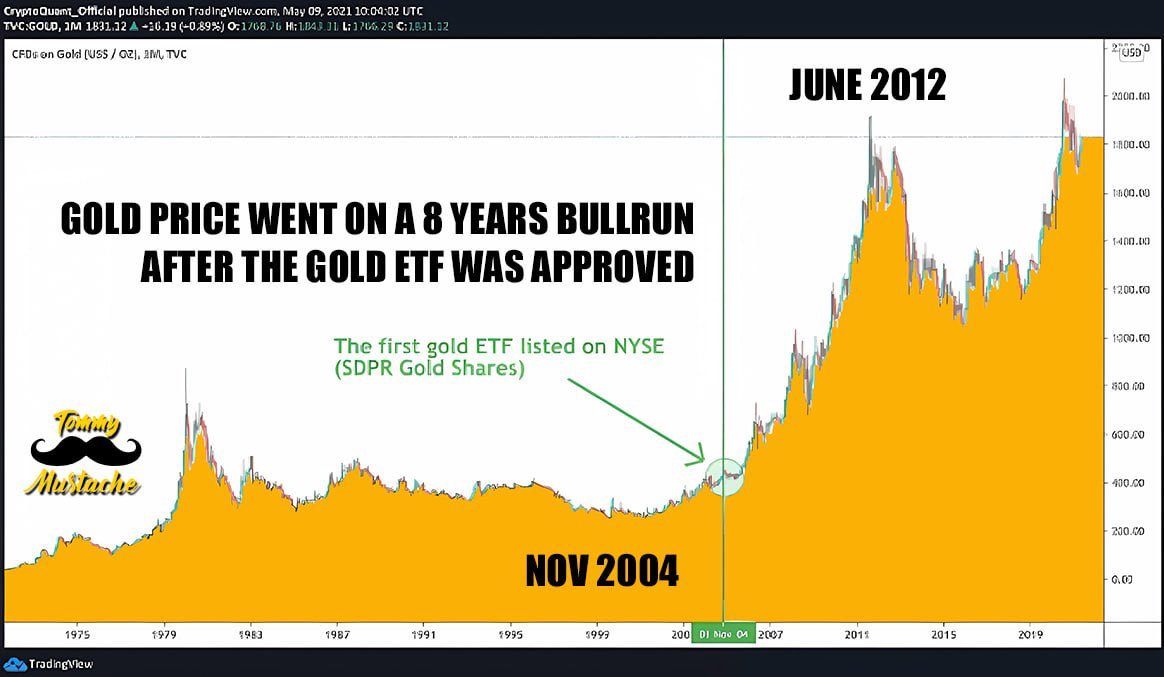
Gold Chart By Trading ViewLooking at the weekly chart, the closest resistance area seems to be found at $1,800. This area helped create a triple top during the end of 2020. Therefore, it would make sense for the current rally to end at this level.
In addition, we can see a strong bearish divergence even in the weekly time-frame, which confirms that the price is very likely to head downwards.
Gold Chart By Trading View Comparison to BitcoinWhen comparing the gold price (candlesticks) to that of Bitcoin (orange), we can see that the latter has fared much worse since the rapid decrease on March 9-12. While gold has increased by 3% relative to the price on March 9, BTC has decreased by 21%.
Therefore, the recovery of gold has been much quicker than that of BTC, since the price has already reached a new high relative to that in March.
Gold Chart By Trading ViewTo conclude, the gold price has reclaimed the entire losses stemming from the rapid decrease in March. However, the price has been showing significant weakness in the form of bearish divergence in the RSI. The likeliest level to reverse the current bullish trend is found at $1,800.
The post Is the Gold Price Doomed to Follow in the Footsteps of Oil? appeared first on BeInCrypto.
origin »Bitcoin price in Telegram @btc_price_every_hour
Golos Gold (GBG) на Currencies.ru
|
|


