2022-7-8 00:00 |
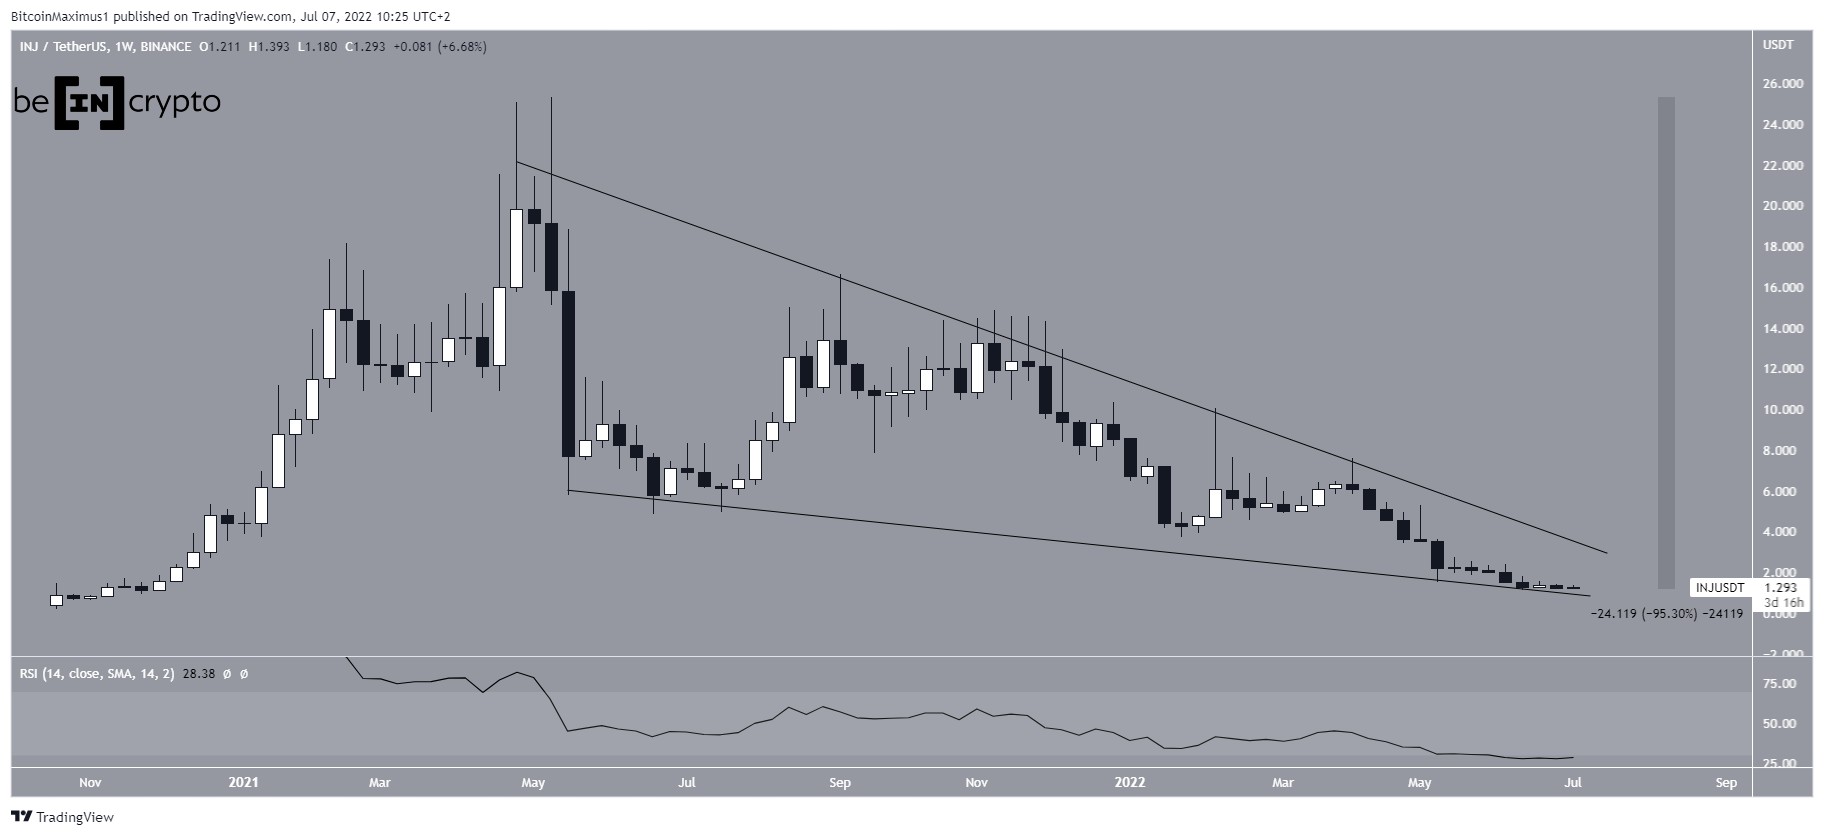
Injective (INJ) has been generating bullish divergence inside a bullish pattern since May 9. It is possible that a breakout will soon follow.
It has been falling since reaching an all-time high price of $25.30 in May 2021. The downward movement has been contained inside a descending wedge, which is considered a bullish pattern. Therefore, a breakout from it would be the most likely scenario.
Additionally, the weekly RSI is inside oversold territory at 27. This is also a new all-time low and the first time the RSI has fallen to oversold territory.
So far, the price has reached a low of $1.13, which is a decrease of 95% measuring from the all-time high.
INJ/USDT Chart By TradingView Potential breakoutCryptocurrency trader @ZAYKCharts tweeted a chart of INJ which shows a potential breakout from a long-term descending wedge.
Source: TwitterSimilar to the weekly chart, the daily one shows that INJ is trading inside a descending wedge that has been in place since May 9. Since the exact slope of the resistance line is not determined due to the presence of several long upper wicks, it is not yet certain if the price has broken out.
The daily RSI has generated significant bullish divergence, a sign that a potential breakout is likely.
If one occurs, the closest resistance area would be at $2.30.
INJ/USDT Chart By TradingView INJ/BTCThe INJ/BTC pair shows similar movement to the USD pair. The RSI has generated considerable bullish divergence while the price seems to have made a double bottom.
Besides the bullish divergence, the RSI has generated an ascending triangle. As a result, a RSI breakout followed by a price breakout would be the most likely scenario.
If one occurs, the closest resistance would be at 9300 satoshis.
INJ/BTC Chart By TradingViewFor Be[in]Crypto’s latest bitcoin (BTC) analysis, click here
The post Injective (INJ) Reaches Convergence Point of Bullish Pattern appeared first on BeInCrypto.
origin »Bitcoin price in Telegram @btc_price_every_hour
Injective Protocol (INJ) на Currencies.ru
|
|


