Новости о Triangle Breakout [ Фото новости ] [ Свежие новости ] | |

VET / USD Price Analysis: Consolidation Period
VeChain has a bullish short-term bias, with the cryptocurrency continuing to trade above major technical support The four-hour time frame shows a bullish descending triangle breakout in progress The inverted head and shoulders pattern on the daily time frame has now reached its upside target VeChain / USD Short-term price analysis VeChain has a bullish […] The post VET / USD Price Analysis: Consolidation Period appeared first on Crypto Briefing. дальше »
2019-4-20 18:09 | |
|
|
Tezos / USD Technical Analysis: Second Stage Firing
Tezos remains bullish in the short-term, with the XTZ / USD pair breaking above a triangle pattern on the four-hour time frame The daily time frame also shows that a bullish breakout from a triangle is underway The large inverted head and shoulders pattern on the daily time frame has reached its overall upside objective […] The post Tezos / USD Technical Analysis: Second Stage Firing appeared first on Crypto Briefing. дальше »
2019-4-16 18:13 | |
|
|
Ethereum Price Analysis: ETH/USD Breakout is Highly Anticipated
Coinspeaker Ethereum Price Analysis: ETH/USD Breakout is Highly AnticipatedIn case the Bulls gain enough momentum to push up Ethereum price and break the upper trend line of the triangle and sustain the momentum, the ETH price may reach $149 - $161; otherwise, the bearish breakout will target $134. дальше »
2019-3-21 11:07 | |
|
|
Bitcoin (BTC) Price Analysis: Another Upside Breakout Attempt
Bitcoin is back to testing the top of the symmetrical triangle visible on the 4-hour chart, perhaps making another attempt to break higher and sustain an uptrend. A strong close above the $4,100 to $4,200. дальше »
2019-3-18 07:14 | |
|
|
IOTA Price Prediction: The Price Is Nearing a Breakout From the Triangle
Long-Term Outlook A look at the Weekly chart for IOTA shows that the price is trading near $0. 3, facing very close resistance from the 21-period moving average. It is also trading below the 50-period MA and the Ichimoku Cloud. дальше »
2019-3-15 15:14 | |
|
|
Bittorrent [BTT] & Quantum [QTUM] Price Action- BTT Continues Decline, QTUM Top Performer After Ascending Triangle Breakout
Justin Sun, founder of the Tron blockchain and also the issuer of BitTorrent tokens (BTT) which were issued on the Tron blockchain, has announced another campaign. This campaign involves giveaways. дальше »
2019-3-14 19:59 | |
|
|
XRP Price Analysis: XRP/USD Remains within $0.32 – $0.30 Consolidating
CoinSpeaker XRP Price Analysis: XRP/USD Remains within $0. 32 – $0. 30 ConsolidatingThe breakout of the XRP price either at the lower or upper trend line of the triangle is possible; the break out at the upper trend line will push the coin towards the supply level of $0. дальше »
2019-3-13 09:07 | |
|
|

XRP Price Under Pressure Again
By Dmitriy Gurkovskiy, Chief Analyst at RoboForex XRP is going down and trading at $0. 3139 on March 12. On H1, the price is still forming a consolidation triangle as a part of an ascending channel after the long term resistance breakout. дальше »
2019-3-12 18:22 | |
|
|
Tron [TRX] Price Prediction: The End of the Symmetrical Triangle Is Near, When Will the Breakout Occur?
Long-Term Outlook A look at the Weekly chart for XLM shows that the price is currently trading at $0. 024, between the 21 and 50-period moving averages. It has found support above the 21-period MA. дальше »
2019-3-6 13:19 | |
|
|

Bitcoin Price Analysis: Short-Term Support Breaks on High Volume and Spread
Leading into the London open, bitcoin broke through its local support level in a move that seems to be hinting toward a downward continuation:Figure 1: BTC-USD, Daily Candles, Broken Local SupportSo far, our daily candle has yet to close, but it is currently on schedule to close below local support. дальше »
2019-3-5 02:43 | |
|
|
Dogecoin Price Analysis: DOGE Is Trading Inside a Symmetrical Triangle, When Will the Breakout Occur?
Long-Term Outlook A look at the Weekly chart for Dogecoin shows that price is trading inside the major support area near $0. 0019 formed by previous lows and has found support right above the 200-period MA. дальше »
2019-3-4 19:59 | |
|
|
Bitcoin Price Analysis: Keep an Eye Out for a Close Above the Current High
Shortly after falling from its test of the low $4,000s, bitcoin managed to find support in the mid $3,500s. This has proven to be a relevant level over the last few months, and finding support here would be a sign of relatively strong demand:Figure 1: BTC-USD, Daily Candles, Local SupportThe high candle spread rejection following our test of the low $4,000s was an indication that we had strong levels of supply left in the market, but for the time being we are holding support. дальше »
2019-3-1 03:44 | |
|
|
Bitcoin Price Analysis: Bullish Rejection Wipes Out Bitcoin’s Weekend Gains
Over the weekend, a strong rally was stifled by an even stronger rejection as the bitcoin market was shoved into a band of overhanging resistance. This band of resistance has been mentioned several times in our analyses over the last few weeks as it has proven impossible to overcome for the time being:Figure 1: BTC-USD, Daily Candles, Failed BreakoutThis run to the low $4,000s coincided with a breakout of a rather large symmetrical triangle consolidation shown above. дальше »
2019-2-26 02:42 | |
|
|
Bitcoin Price Analysis: Bullish Setups Could Break Current Market Structure
The cryptomarket remains coiled as we lead into the weekend with no new highs and no new lows being established for bitcoin. However, it is nicely consolidating on lower time frames and hints toward the possibility of another leg up:Figure 1: BTC-USD, Hourly Candles, Consolidating PennantThe pattern shown in Figure 1 outlines a potential continuation pattern called a “bullish pennant. дальше »
2019-2-23 02:23 | |
|
|
Bitcoin Price Analysis: Consolidation Breaks Out Into Macro Resistance Test
Over the course of the last 10 days, bitcoin has managed to rally nearly 20% in value as it burst through two major resistance levels and is now beginning the test of a major macro level:Figure 1: BTC-USD, Daily Candles, Macro ResistanceWe can see a clear, descending supply-and-demand channel that governed the market for the last two months. дальше »
2019-2-20 01:38 | |
|
|
EOS Price Prediction: Price Is Possibly Moving in an Ascending Triangle, Is the Breakout Occurring?
Long-Term Outlook A look at the Weekly chart for EOS shows that price is trading inside the minor resistance area at $3. The price is trading below the 21,50 period MA and the Ichimoku Cloud. After the breakdown at $5, price bottomed near $2 and quickly launched an upward move. дальше »
2019-2-18 15:09 | |
|
|
Bitcoin (BTC) Price Analysis: Aiming for Triangle Top Next!
Bitcoin broke above its short-term descending channel to confirm that the climb is gaining traction. This also completes a breakout from the bullish flag continuation pattern, indicating that a climb of the same height as. дальше »
2019-2-18 08:13 | |
|
|
XRP Price Stable Against Coinmotion Criticism
By Dmitriy Gurkovskiy, Chief Analyst at RoboForex On Feb 15, the XRP is moving up slightly, trading at $0. 3089. Over a few weeks, the crypto has been forming a triangle, still without testing either the resistance or the support. дальше »
2019-2-15 20:23 | |
|
|
Bitcoin (BTC) Price Analysis: Another Breakout To Look Out For
Bitcoin has also formed a triangle chart pattern which might show an earlier breakout as a preview for its reversal formation. Price has bounced off the triangle bottom and might be due for a test of resistance at the $4,200 mark next. дальше »
2019-1-3 06:06 | |
|
|
Ethereum (ETH) Price Analysis: Downside Triangle Breakout
Ethereum was previously consolidating inside a symmetrical triangle pattern and has broken below support to signal that further declines are in the works. Price could be due for a quick pullback to support before heading further south. дальше »
2018-12-14 06:50 | |
|
|
Bitcoin (BTC) Price Analysis: Another Triangle Breakout!
Bitcoin previously consolidated inside a symmetrical triangle to signal a pause from its decline, but this served as a continuation signal. Price already closed below support and the $4,000 major psychological mark to confirm that bears are still in control. дальше »
2018-12-4 06:30 | |
|
|

Bitcoin Price Analysis: Another Red Day Pushes BTC Into Deeper Support Test
Bitcoin has tumbled again today as the market continues to see further downward movement shortly after breaking two areas of market support. So far, bitcoin is down 15% on the day — 25% in 1 week:Figure 1: BTC-USD, Daily Candles, Downward ContinuationThis drop below support is starting to display hallmarks of market capitulation. дальше »
2018-11-20 02:27 | |
|
|
Bitcoin Price Analysis: Yearly Support Breaks as Bitcoin Tests Underlying Demand
After months and months of consolidation, the yearly support finally broke and now bitcoin has found itself in the lower $5000s for the first time since 2017:Figure 1: BTC-USD, Daily Candles, Broken SupportBitcoin managed to drop a staggering 16% yesterday as the market sliced through the long held support like a knife through butter. дальше »
2018-11-16 01:28 | |
|
|
Traders Stay on the Sidelines As Bitcoins Price Stagnates
Bitcoin seems to be in a never-ending range between $6380 and $6480. The anticipated breakout never materialized, and price action is now trading right at the point of the triangle pattern which has been forming since January. дальше »
2018-10-26 17:34 | |
|
|
Volatility Continues to Hit 2018 Lows for Bitcoin As Price Trades Sideways
It is highly unusual for price action to come right to the point of a triangle pattern. Typically, a breakout either above or below the pattern as price approaches its end. As Bitcoin approached the end of the triangle pattern over the past couple of months, any breakout from price action has been brought quickly […] Volatility Continues to Hit 2018 Lows for Bitcoin As Price Trades Sideways was originally found on [blokt] - Blockchain, Bitcoin & Cryptocurrency News. дальше »
2018-10-25 17:57 | |
|
|
Bitcoin (BTC) Price Analysis: Upside and Downside Barriers
Bitcoin is still waiting on a symmetrical triangle consolidation breakout but has to also contend with nearby upside and downside barriers outside the formation. After all, price also seems to be moving in a range with resistance at $6,450 and support around $6,350. дальше »
2018-10-24 07:02 | |
|
|
Bitcoin (BTC) Price Analysis: Bullish Continuation Breakout!
Bitcoin recently formed a flag consolidation pattern after its sharp rally and fade from the triangle top. This is often seen as a bullish continuation signal, with an upside break possibly leading to a climb that’s the same height as the flag’s mast. дальше »
2018-10-18 06:59 | |
|
|
Bitcoin (BTC) Price Watch: Watch This Triangle for Directional Clues
Bitcoin Price Key Highlights Bitcoin price is still stuck in consolidation, forming higher lows and lower highs inside a symmetrical triangle on the short-term chart. Price is approaching the peak of this formation so a breakout might be due soon, providing longer-term directional clues. дальше »
2018-10-17 06:54 | |
|
|
Strong Bullish Outlook for Bitcoin After Recent Spike
After two weeks of consolidation and volatility forming new lows almost every day, it looked as if the price was going to have a bearish breakout. A fall on Thursday saw price trade below the triangle pattern which had been forming since January. дальше »
2018-10-15 17:04 | |
|
|
No Bearish Breakdown? Is the Bitcoin Bear Market Coming to a Conclusion?
A breakout has still not occurred in Bitcoin as the triangle pattern approaches its end. On the logarithmic scale chart, price action has actually managed to break out of the pattern and close above, but this also happened earlier in the year and preceded a sharp decline. дальше »
2018-10-10 16:49 | |
|
|
Bitcoin (BTC) Price Watch: Wait for this Short-Term Breakout
Bitcoin Price Key Highlights Bitcoin price has formed lower highs and higher lows on its 1-hour chart to trade inside a symmetrical triangle. Price is currently testing the bottom of the triangle and might be due for a bounce back to the top around $6,700. дальше »
2018-10-10 08:08 | |
|
|
Is There Going to Be a Breakout for Bitcoin [BTC]?
Many analysts and traders have been anticipating a breakout for the price of Bitcoin as it approaches the end of a triangle pattern which has been forming since January. However, Bitcoin continues to consolidate as it forms another 2018 low for volatility as measured by the Average True Range (ATR). дальше »
2018-10-9 17:39 | |
|
|
Bitcoin Price Update: Breakout Imminent as Price Looks to Move Beyond Descending Triangle
Bitcoin looks set for an imminent price breakout. The price action chart for the top-ranked cryptocurrency shows a classic breakout pattern which could potentially signal an end to the sideways trading of the last two months. дальше »
2018-10-8 19:45 | |
|
|
Traders Remain Unsure of Bitcoin Direction As Volatility Hits 2018 Low
Bitcoin continues to consolidate as October progresses. Price action is trading around the end of the triangle pattern which has been forming since January. In previous articles, we outlined three potential scenarios which could play out. дальше »
2018-10-8 17:29 | |
|
|
Bitcoin (BTC) Price Watch: Is That a Bullish Breakout Yet?
Bitcoin Price Key Highlights Bitcoin price appears to be closing above the top of its symmetrical triangle pattern to show that bulls are gaining the upper hand. If so, this could lead to a rally that’s roughly the same height as the formation, which spans $6,000 to $10,000. дальше »
2018-10-8 06:41 | |
|
|
Bitcoin (BTC) Price Analysis: Bullish Breakout Finally Happening?
Bitcoin has been stuck inside its symmetrical triangle consolidation for quite some time now, but bulls seem to be getting the upper hand. Price is already closing above the triangle top to signal that a longer-term climb is underway. дальше »
2018-10-8 03:52 | |
|
|
Cardano (ADA) Price Analysis: Trends of October 5–11, 2018
The price has formed a “symmetrical triangle” pattern on the 4-Hour chart. It is currently below the 4-day EMA which has crossed the 50-day EMA downward below the supply zone of $0. 08 inside the symmetrical triangle. дальше »
2018-10-6 17:43 | |
|
|
Bitcoin [BTC] Continues Consolidation as Bulls and Bears Battle
Bitcoin is continuing its consolidation as the bulls, and the bears seem unsure on where to place positions for the next breakout. The daily RSI has been consolidating into a triangle and trading around showing there is equal pressure from both the buyers and the sellers. дальше »
2018-10-4 16:14 | |
|
|
Bitcoin (BTC) Price Analysis: Another Bullish Breakout Attempt?
Bitcoin might be attempting a break out of its symmetrical triangle as it aims for the ascending channel resistance. The post Bitcoin (BTC) Price Analysis: Another Bullish Breakout Attempt? appeared first on Ethereum World News. дальше »
2018-10-4 07:27 | |
|
|
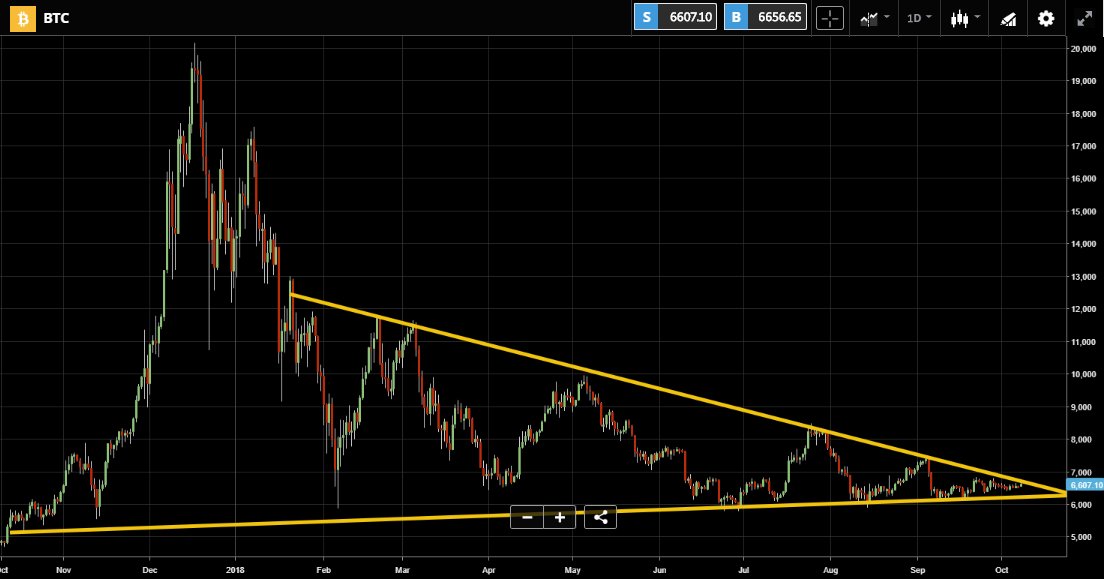
Bitcoin (BTC) Price Watch: Ready for a Long-Term Breakout?
Bitcoin Price Key Highlights Bitcoin is now at the very end of its long-term triangle consolidation pattern, so a breakout could happen anytime soon. Price is currently testing the resistance around $6,600 and a long green candle closing above this could be enough to signal further gains. дальше »
2018-10-4 07:05 | |
|
|
Tron (TRX) Price Analysis: Trends of October 2–8, 2018
There is a probability for the uptrend movement this week in case the price breakout to the north from the ascending triangle pattern formed on both daily and 4-Hour charts. The post Tron (TRX) Price Analysis: Trends of October 2–8, 2018 appeared first on CoinSpeaker. дальше »
2018-10-3 11:30 | |
|
|
Litecoin (LTC) All Set To Finally Break Downtrend
Litecoin (LTC) has never been this bullish in a long time. The above weekly chart for LTC/USD shows how persistently it bottomed out between August and October. In addition to that, Litecoin (LTC) has now found a solid support right next to its downtrend resistance. дальше »
2018-10-2 17:00 | |
|
|
Stellar Lumens (XLM) Price Watch: Ascending Triangle Formation
Stellar Lumens Price Key Highlights Stellar Lumens has formed higher lows and found resistance around 0. 2600 to create an ascending triangle on its 1-hour chart. Price is nearing the peak of its formation so a breakout in either direction could take place really soon. дальше »
2018-10-2 07:24 | |
|
|