Новости о Still Breakout [ Фото новости ] [ Свежие новости ] | |

Ravencoin (RVN) Price Prediction 2019 – Still Flatlining With Hints Of Move Up (May 26th Update)
4H RVNBTC It seems that RVN is forming a declining wedge on this timeframe and we could expect a nice jump for RVN, the target would be the confluence of two Fib zones at 740 sats. Breakout point is this height of 740 sats, if that gets smashed, target is 955 sats, Fib50 level of […] The post Ravencoin (RVN) Price Prediction 2019 – Still Flatlining With Hints Of Move Up (May 26th Update) appeared first on CaptainAltcoin. дальше »
2019-5-26 17:05 | |
|
|
Nano (NANO) Price Analysis Prediction 2019 – NANO Holders Still Waiting For Their “Moon” Day (May 22nd update)
Mid May Update: Technicals 4H NANOBTC After getting rejected on May 16th on the Fib 618 (May 7th high – May 13th low) at 25k sats, Nano has been ranging in a horizontal channel between 22k and 24k sats. дальше »
2019-5-22 01:53 | |
|
|
DigiByte (DGB) Price Analysis And Prediction 2019: Still Hovering Indecisively Around 160 Sats (May 21st Update)
Mid May Update: Technicals 4H DGBBTC DGB was one of the coins that profited the most from bitcoin’s last week’s consolidation as it rallied from the all time lows of 126 sats all the way up to the local resistance of 195 sats. дальше »
2019-5-21 03:30 | |
|
|
Enjin Coin (ENJ) Price Prediction 2019, 2020, 2023 and Beyond – Still In a Mini Correction Phase (May 20th Update)
Mid May Update: Technicals Daily ENJBTC On the daily chart, ENJ is really trying to penetrate the down-slanting trendline and officially end the intermediate bearish trend after it defended the bottom at 1671 satoshis. дальше »
2019-5-20 01:57 | |
|
|
Icon (ICX) Price Prediction 2019 – ICX Is Faltering In An Attempt To Break 5300 Sats (May 19th Update)
Mid May Update: Technicals 4H ICXBTC ICX is currently sitting at a MA50 support at 4850 sats. Minor trend is still bullish as EMA20 and MA50 are aligned in ascending order and ICX is mounting another attempt to break the Fib50 level at 5270 sats. дальше »
2019-5-19 19:32 | |
|
|
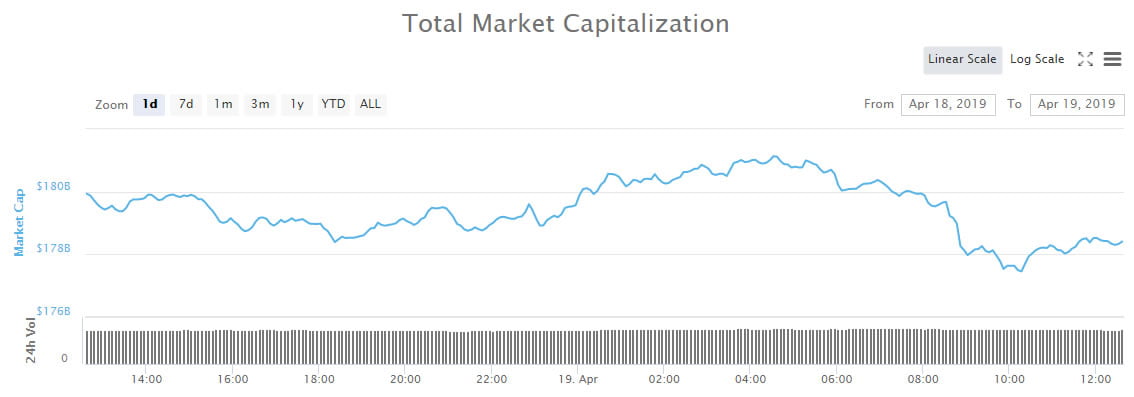
Crypto Market Wrap: Binance Coin Approaching All Time High on DEX Launch
Crypto markets cooling this Friday; Binance Coin dominating, Tezos still running, Bitcoin Cash and Cardano dumping. Market Wrap There has been a slight pullback today following yesterday’s push to $180 billion. дальше »
2019-4-19 10:00 | |
|
|

Binance Coin Price Surpasses $20 in New Bullish Breakout
As the week is now officially halfway, there are still a lot of eyes on the different top markets first and foremost. While no real sense of weakness is detected as of right now, it would appear interesting shifts are happening nonetheless. дальше »
2019-4-18 10:23 | |
|
|

Chinese Crypto Legend Doesn’t Expect Bitcoin (BTC) Breakout, But He’s Still Bullish
BTC Set To Range Between $4,000 And $6,000 According to 8BTC, an Asia-centric crypto outlet, Zhao Dong, one of China’s biggest names in the Bitcoin space, has taken to Weibo to express his thoughts on. дальше »
2019-4-12 07:00 | |
|
|

Bitcoin at $5,000: What Has Changed Since 2017
This article was originally published by 8btc and written by Olusegun Ogundeji. Bitcoin has crossed the $5,000 price range again (after its first reach to that level in 2017) following a sudden breakout on April 2, 2019. дальше »
2019-4-4 18:42 | |
|
|

Not Out Of The Woods? Bitcoin (BTC) Needs To Pass $4,400 To Confirm Breakout
Bitcoin Still To Meet Key Resistances While Bitcoin (BTC) has seemingly broken clean past $4,000, as it failed to pullback under that level during Friday night’s brief sell-off, analysts are sure that the cryptocurrency still. дальше »
2019-3-31 04:50 | |
|
|

Bitcoin Price Analysis: Slow Upward Drift Tests Market Supply
A slow, grinding upward drift has been the name of the game for bitcoin’s market over the last few weeks. The upward drift is bringing us slowly to a level that was previously rejected violently:Figure 1: BTC-USD, Daily Candles, Upward DriftOur third rejection of the red resistance level shown above brought the market into a test of macro support in the mid-$3,000s. дальше »
2019-3-23 01:23 | |
|
|
Bitcoin Price Analysis: Slow Grind Could Lead to Short Squeeze
Last Friday, we discussed a macro resistance level bitcoin would likely test. The level was tested three times prior and immediately rejected. Now, for the fourth time, we find ourselves situated above the level as we wait to see if our support holds:Figure 1: BTC-USD, Daily Candles, Fourth Test of Macro ResistanceThe first three attempts to hold support above the black, broken resistance have been stifled with relatively high amounts of volume. дальше »
2019-3-19 01:17 | |
|
|
XRP Price Under Pressure Again
By Dmitriy Gurkovskiy, Chief Analyst at RoboForex XRP is going down and trading at $0. 3139 on March 12. On H1, the price is still forming a consolidation triangle as a part of an ascending channel after the long term resistance breakout. дальше »
2019-3-12 18:22 | |
|
|
Binance Coin (BNB) Long-term Price Analysis – March 3
BNB/USD may afterward experience a breakout or a breakdown at $12 and $10 price points. This crypto still has a high probability of pushing into other higher range spot or zones. BNB/USD Long-term Trend – Ranging Distribution territories: $14, $16, $18 Accumulation territories: $6, $5, $4 In the last couple of trading days, the market […] дальше »
2019-3-3 11:34 | |
|
|
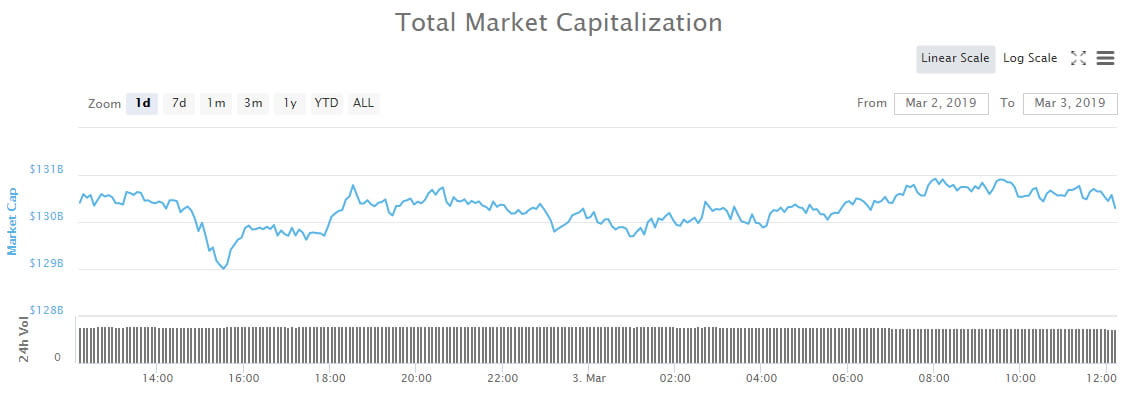
Crypto Market Wrap: The Tedium Continues, When Can We Expect a Breakout?
Crypto markets sleeping on Sunday; Zero movement on the majors, Litecoin getting a lift, Binance Coin still buoyant. Market Wrap The crypto market tedium continues as the weekend rolls into Sunday. дальше »
2019-3-3 10:00 | |
|
|
Bitcoin Price Analysis: Bullish Setups Could Break Current Market Structure
The cryptomarket remains coiled as we lead into the weekend with no new highs and no new lows being established for bitcoin. However, it is nicely consolidating on lower time frames and hints toward the possibility of another leg up:Figure 1: BTC-USD, Hourly Candles, Consolidating PennantThe pattern shown in Figure 1 outlines a potential continuation pattern called a “bullish pennant. дальше »
2019-2-23 02:23 | |
|
|
Bitcoin Price Analysis: Consolidation Breaks Out Into Macro Resistance Test
Over the course of the last 10 days, bitcoin has managed to rally nearly 20% in value as it burst through two major resistance levels and is now beginning the test of a major macro level:Figure 1: BTC-USD, Daily Candles, Macro ResistanceWe can see a clear, descending supply-and-demand channel that governed the market for the last two months. дальше »
2019-2-20 01:38 | |
|
|
Crypto Market Wrap: Consolidation Continues, Is a Breakout Imminent?
Market Wrap Crypto consolidation continues; Litecoin still inching up, NEO making progress, everything else is flat. Crypto markets are looking a little erratic as we enter the weekend but in the grand scheme of things nothing has changed over the past seven days. дальше »
2019-2-16 10:00 | |
|
|
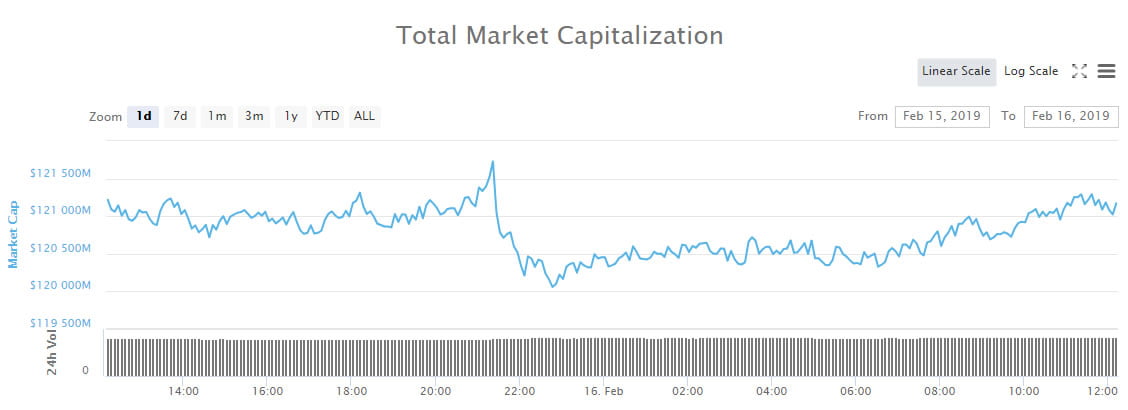
XRP Price Stable Against Coinmotion Criticism
By Dmitriy Gurkovskiy, Chief Analyst at RoboForex On Feb 15, the XRP is moving up slightly, trading at $0. 3089. Over a few weeks, the crypto has been forming a triangle, still without testing either the resistance or the support. дальше »
2019-2-15 20:23 | |
|
|
Bitcoin (BTC) Price Analysis: A Closer Look at the Bullish Flag Levels
Bitcoin is still stuck in its bullish flag pattern and waiting for momentum to return while consolidating in a small channel. Looking closer at this channel shows the levels to watch to gauge a breakout or pullback. дальше »
2019-2-14 07:01 | |
|
|
Bitcoin Price Analysis: Bitcoin Tests Boundary Support as Demand Weakens
Following last Friday’s drop, bitcoin has found itself coiled, once again, at the bottom of the range it established back in December. With the current market unable to close a new high, the market finds itself in a precarious position:Figure 1: BTC-USD, Daily Candles, Range Support TestThe blue support level shown above illustrates the boundary of the multi-week range bitcoin has been bound by. дальше »
2019-1-18 02:02 | |
|
|

Short-term XRP Price Predictions Favor Bullish Momentum
It has become apparent the cryptocurrency industry will not see any major breakout soon. Any positive momentum established during early 2019 has been obliterated already. Despite the odds, speculators still have high hopes for the XRP price. дальше »
2019-1-17 15:00 | |
|
|

Bitcoin (BTC) Price Analysis: Another Triangle Breakout!
Bitcoin previously consolidated inside a symmetrical triangle to signal a pause from its decline, but this served as a continuation signal. Price already closed below support and the $4,000 major psychological mark to confirm that bears are still in control. дальше »
2018-12-4 06:30 | |
|
|

Tether Will Soon Allow Direct Redemption of USDT — But With a High Minimum
Tether is launching a new liquidity portal, one that will finally allow the direct redemption of Tether’s stablecoin USDT back into fiat. According to a new report released on the company’s website, Tether is going to “launch a redesigned platform allowing for the verification of new customers and direct redemption of Tether to fiat. дальше »
2018-11-28 01:21 | |
|
|

Bitcoin Price Analysis: Another Red Day Pushes BTC Into Deeper Support Test
Bitcoin has tumbled again today as the market continues to see further downward movement shortly after breaking two areas of market support. So far, bitcoin is down 15% on the day — 25% in 1 week:Figure 1: BTC-USD, Daily Candles, Downward ContinuationThis drop below support is starting to display hallmarks of market capitulation. дальше »
2018-11-20 02:27 | |
|
|
Bitcoin Price Analysis: Yearly Support Breaks as Bitcoin Tests Underlying Demand
After months and months of consolidation, the yearly support finally broke and now bitcoin has found itself in the lower $5000s for the first time since 2017:Figure 1: BTC-USD, Daily Candles, Broken SupportBitcoin managed to drop a staggering 16% yesterday as the market sliced through the long held support like a knife through butter. дальше »
2018-11-16 01:28 | |
|
|
Bitcoin (BTC) Price Analysis: Key Resistance to Watch
Bitcoin volatility has been low once more, leading many to speculate that a big breakout might be brewing. Price is still keeping its head above a rising channel seen on the 4-hour time frame but has also formed lower highs and is below a shorter-term trend line. дальше »
2018-11-13 05:59 | |
|
|
Bitcoin (BTC) Price Analysis: Upside and Downside Barriers
Bitcoin is still waiting on a symmetrical triangle consolidation breakout but has to also contend with nearby upside and downside barriers outside the formation. After all, price also seems to be moving in a range with resistance at $6,450 and support around $6,350. дальше »
2018-10-24 07:02 | |
|
|
Bitcoin (BTC) Price Watch: Watch This Triangle for Directional Clues
Bitcoin Price Key Highlights Bitcoin price is still stuck in consolidation, forming higher lows and lower highs inside a symmetrical triangle on the short-term chart. Price is approaching the peak of this formation so a breakout might be due soon, providing longer-term directional clues. дальше »
2018-10-17 06:54 | |
|
|
Novogratz: Bitcoin Will Breakout in 2019, But Institutions Still Want Crypto
Despite recently retracting his bullish claims that Bitcoin will surpass $10,000 by year’s end, Mike Novogratz still expressed that institutions are still poised to enter the crypto industry. дальше »
2018-10-16 12:00 | |
|
|
Bitcoin (BTC) Price Update: Mini-rally Nearly Reaches $7,000 as Tether Sinks to 97 Cents
Bitcoin temporarily seemed to be on the cusp of breaking beyond $7,000 as the Tether (USDT) liquidity issue finally caused a breakout. The top-ranked cryptocurrency peaked at $6,900 before a pullback saw it drop over $300 but still maintain a positive 24-hour price change. дальше »
2018-10-15 13:18 | |
|
|
No Bearish Breakdown? Is the Bitcoin Bear Market Coming to a Conclusion?
A breakout has still not occurred in Bitcoin as the triangle pattern approaches its end. On the logarithmic scale chart, price action has actually managed to break out of the pattern and close above, but this also happened earlier in the year and preceded a sharp decline. дальше »
2018-10-10 16:49 | |
|
|
Stellar (XLM)’s Next Breakout Might Steal Ripple (XRP)’s Thunder
Stellar (XLM) has seen growing institutional interest over the past few months. A survey report by Fundstrat recently showed that institutional investors believe Stellar (XLM) to be a promising project. дальше »
2018-10-9 00:30 | |
|
|
Bitcoin Price Watch: Currency Still Unmoving, though a Breakout Is Still Possible
At press time, the father of cryptocurrency is still trading in the $6,500 range. Nothing has been altered in bitcoin’s present course; it’s stayed in this range for the past several days and isn’t looking to move. дальше »
2018-10-7 00:48 | |
|
|
Bitcoin (BTC) Price Watch: Still Stuck in Consolidation, Breakout Soon?
Bitcoin Price Key Highlights Bitcoin price is still stuck inside its triangle consolidation pattern on the 1-hour time frame. Price is nearing the peak of its formation so a breakout could take place soon. дальше »
2018-10-2 07:12 | |
|
|
Bitcoin (BTC) Price Watch: Some Hesitation After Bullish Breakout?
Bitcoin Price Key Highlights Bitcoin price has recently broken out of its symmetrical triangle pattern but has since pulled back for a retest. Price continues to hover around the broken resistance, though, and might still have a chance at falling back in consolidation. дальше »
2018-10-1 07:27 | |
|
|
Bitcoin (BTC) Price Watch: Will a Triangle Breakout Happen Soon?
Bitcoin Price Key Highlights Bitcoin price is still consolidating in a triangle pattern visible on the 4-hour time frame after bouncing off the top. Price could be due for a test of support but could attempt another break past the triangle resistance. дальше »
2018-9-27 06:52 | |
|
|

Ethereum (ETH) Price Watch: Still Waiting for a Triangle Breakout
Ethereum Price Key Highlights Ethereum has formed lower highs and higher lows to create a symmetrical triangle pattern on its 1-hour chart. Price is currently bouncing off support and might be due for another test of the top. дальше »
2018-9-20 07:54 | |
|
|
Bitcoin (BTC) Price Watch: Bearish Wedge Breakout
Bitcoin Price Key Highlights Bitcoin price recently broke below a rising wedge pattern to signal that further losses are in the cards. Price might still pull back to the broken support area, which lines up with Fib levels, to gather more selling pressure. дальше »
2018-9-18 06:52 | |
|
|
Bitcoin Price Watch: BTC/USD Approaching Next Key Break
Key Points Bitcoin price is preparing for the next move with resistances near $6,385 and $6,530 against the US Dollar. Yesterday’s highlighted major breakout pattern is still active with resistance at $6,385 on the hourly chart of the BTC/USD pair (data feed from Kraken). дальше »
2018-9-11 11:48 | |
|
|
Bitcoin (BTC) Price Watch: Still Waiting for Directional Clues
Bitcoin Price Key Highlights Bitcoin price is trending below a short-term descending trend line as it hovers at the long-term floor. Traders are likely waiting for the next catalysts to decide which direction the breakout could take. дальше »
2018-8-13 07:08 | |
|
|

There is lack of stability among the factors preventing global bitcoin breakout
Swiss-based investment bank and financial services company the Union Bank of Switzerland (UBS) said that Bitcoin’s (BTC) scalability and volatility are still too high for the cryptocurrency to be used as “money,” CNBC reported August 2. дальше »
2018-8-3 19:35 | |
|
|

Bitcoin price requirements go up to $ 8350 Bull BIOS back
Bitcoin’s (BTC) price is consolidating in a narrow range at press time and could regain bullish momentum above $8,350, technical charts indicate. The upside has been capped around $8,300 and the dips to $8,050 have been short-lived, according to Bitfinex. дальше »
2018-7-30 16:28 | |
|
|