Новости о Run Chart [ Фото новости ] [ Свежие новости ] | |

Gold Versus Bitcoin Chart Makes It Seem Like Bull Run Has Barely Begun
One of the biggest factors influencing the recent Bitcoin bull run hands down has been the digital gold narrative and the capital flows from precious metals into crypto. However, looking back at the XAUBTC chart over the last several months, the recent retracement across crypto makes it look like the bull run never even started, […] дальше »
2021-7-30 23:03 | |
|
|

BTC Supporters Call Price Drop a Mid-Bull Run Break, 2021 Bitcoin Chart Pattern Similar to 2013 Bull Run
After the price of bitcoin touched a high of $64,895 per unit, speculators and skeptics think it might have been the top of the bull run and a 2018-like bear run is next. On Sunday, May 23, bitcoin prices have dropped to a low of $31,107 and bears have managed to take the reigns for […] дальше »
2021-5-24 01:00 | |
|
|
How the “West” Is Driving Bitcoin’s Bull Market, But Asia Is Resisting
Bitcoin’s price is moving sideways in a critical support zone. At the time of writing, BTC’s price is trading at $55.780 with 0.3% in the daily chart and 7.3% losses in the weekly chart. According to Arcane Research’s most recent report, BTC’s 2020 and 2021 bull run has been heavily affected by the dynamics from […] дальше »
2021-4-21 19:09 | |
|
|
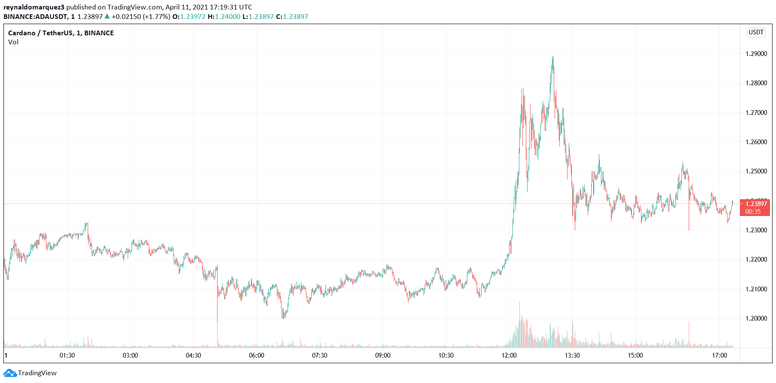
Why ADA could run hotter than Bitcoin and make 10x gains
After breaking in the crypto top 10 by market cap and with 3. 597% gains over the past year, Cardano (ADA) seems to be laying low. At the time of writing, ADA trades at $1,24 with 1. 7% profits in the daily chart and 6. дальше »
2021-4-12 22:00 | |
|
|
Cardano short-term Price Analysis: 25 November
Cardano is currently manifesting its 2nd bullish leg for the year after its run in June 2020. Attaining a new $0.1835 yesterday, Cardano is currently on a minor decline on the short-term chart. While The post Cardano short-term Price Analysis: 25 November appeared first on AMBCrypto. дальше »
2020-11-25 17:00 | |
|
|
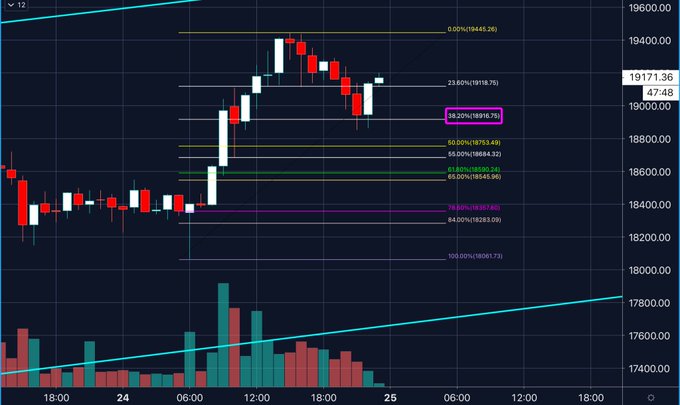
Bitcoin Could Run to New Highs as BTC Forms Tweezer Bottom at $19,000
Bitcoin has undergone its latest leg higher just recently, pushing to $19,450 on top exchanges. The coin now trades for $19,150 after a slight retracement. Analysts remain bullish as the chart remains bullish: a trader said that the coin just formed a tweezer bottom when it went to test the lows at $18,900. дальше »
2020-11-26 15:00 | |
|
|

Trader: Bitcoin Bull Run Could “Force XRP Army To Surrender,” Admit Defeat
This week, Bitcoin shocked the world with a push beyond $15,000 and nearly hitting $16,000. At the time, altcoins bled out, but few more so than XRP. One crypto trader has shared a nasty looking long-term chart for Ripple, and believes that Bitcoin’s rally could finally force the “XRP army” to surrender and “admit defeat.” […] дальше »
2020-11-7 23:00 | |
|
|

Bitcoin (BTC) price approaching profit-taking zone as bulls eye $13,800
Bitcoin (BTC) price has continued its impressive bull run to trade above the $12k handle again. As predicted by Invezz a few days ago, the BTC/USD price activated the bull pennant chart pattern that is facilitating a move to $12,400. дальше »
2020-10-21 14:41 | |
|
|
Can Bitcoin's next bull run be in the works?
Have you been missing the price action in Bitcoin markets across exchanges lately? Based on WooBull’s Bitcoin volatility chart, 60-day volatility is 5.65 and 90-day volatility is 8.95. The recent drThe post Can Bitcoin's next bull run be in the works? appeared first on AMBCrypto. дальше »
2020-10-7 13:00 | |
|
|
IOTA Signals Bull Run After Forming Its First Weekly Golden Cross
IOTA, a transaction settlement token for the Internet of Things (IoT), has surged by more than 400 percent from its March 2020 nadir. Its price rally this week led to the formation of its first Golden Cross on a weekly chart. дальше »
2020-7-31 16:04 | |
|
|

Historical Data Reveals Bitcoin On The Cusp Of Having Its First Post-Halving Moonshot
If historical data can predict the future, then we are on the cusp of a massive bull run in 10 weeks after the 3rd Bitcoin halving. Analyst Josh Rager posted a Bitcoin chart with emphasis on when the halving took place. дальше »
2020-7-25 13:26 | |
|
|
Cardano Has More Room to Go Up Based On These On-Chain Metrics
One of the so-called “Ethereum killers,” Cardano has made it to the headlines of the cryptocurrency market after the 80% bull run it has seen over the past week. The increasing buying pressure behind it seems to be fueled by the progress the IOHK team has made to finally roll-out the Shelley upgrade. Chart of […] дальше »
2020-7-9 21:00 | |
|
|

Bull Run Imminent? Hodl Waves Chart Shows 60% of Bitcoin Hasn’t Moved in a Year
According to the creator of the analytical bitcoin data web portal, Look Into Bitcoin, a chart often referred to as ‘Hodl Waves’ shows a bull run could be imminent. The web portal’s analyst Phillip Swift recently tweeted that 60% of all the bitcoin in circulation hasn’t moved in twelve months. дальше »
2020-5-28 16:35 | |
|
|

The Same Chart That Nailed Ethereum’s $90 Bottom Is Now Calling a Top
Like Bitcoin, Ethereum has been on a remarkable run over the past few weeks. Arguably, the asset’s performance has been even more impressive than that of BTC over the same time period. Case in point: per data from TradingView. дальше »
2020-4-26 04:00 | |
|
|
Bitcoin, Ethereum, and XRP Lead Market Rally
A massive capital inflow triggered a rally felt through the entire market. Now, led by Bitcoin, Ethereum, and XRP the market seems prepared to enter another bull run. Bitcoin Outlook After $8,500 Based on the 1-week chart, several technical indicators reveal that Bitcoin is extremely bullish. дальше »
2020-1-15 00:06 | |
|
|
Bitcoin’s bull run may have started last week based on this technical index
Bitcoin could have entered a new bull market last week based on a technical indicator that has been extremely effective at determining previous parabolic movements. Determining the trend’s direction In a recent tweet, Sawcruhteez, a financial analyst and swing trader, emphasized that the parabolic SAR presented a buy signal on BTC’s 1-week chart. дальше »
2020-1-13 21:00 | |
|
|
Bitcoin Chart Printed This Bullish Signal As Price Retook $7,400
Since plunging to $6,400 around December 18th and rocketing back to $7,000 the day later, Bitcoin has stalled, flatlining in the low-$7,000s as the market remains largely directionless. Related Reading: Why the Bitcoin’s Bearish MACD Cross May Not Plunge Price But on Saturday, BTC started to show that it had room to run, with the... The post appeared first on NewsBTC. дальше »
2019-12-30 22:32 | |
|
|
Cryptocurrency Analysis and Forecast for 7 August: BTC, ETH, and TRX
Bitcoin (BTC/USD) On an intraday chart, BTC/USD pair faced a bearish run after exhibiting price rejection above $12000 level. The downward pressure was however signaled by the 21 day MA that is gravitating above the 7 day MA that signaled to increase in sellouts. дальше »
2019-8-8 00:14 | |
|
|
Bitcoin Cash, Monero and Litecoin Price Prediction and Analysis for August 1st: BCH, XMR, and LTC
Bitcoin Cash Price Analysis (BCH/USD) On an hourly chart, BCH/USD pair has impressively performed. It seemed like the recent Bull Run of BTC has positively affected the price of many cryptocurrencies, BCH included. дальше »
2019-8-1 14:55 | |
|
|
Litecoin Could Blast Off Due to Halving and Wave Two of Bull Run
The Litecoin halving is just a few days away. Even with this bullish catalyst on the horizon, the No. 4 cryptocurrency appears to be struggling against bitcoin. Litecoin (LTC/BTC) has posted four consecutive red candles on the monthly chart against bitcoin. дальше »
2019-7-28 22:30 | |
|
|

Bitcoin Price Analysis: Bearish Divergence to $8.8K Likely
Price action for Bitcoin over the last few weeks seems to have created three higher highs visible on most time-frames. Despite the Bullish sentiment, most indicators have created three lower lows displaying potential bearish divergence around $9,800. дальше »
2019-7-26 13:25 | |
|
|
Bitcoin (BTC), Litecoin (LTC), and Ripple (XRP) Analysis: Market Seeing A Retracement Before Next Run
Bitcoin BTC/USD Market Forecast From yesterday's high at $10976. 7 the price of Bitcoin has decreased by 9. 62% as it came down to $9920. 6 at its lowest point today around which the price is currently being traded. дальше »
2019-7-23 17:56 | |
|
|
Stellar (XLM), Cardano (ADA), and XRP Price Forecast and Analysis – July 17
Stellar (XLM/USD) XLM/USD seemed to have undergone a Bear Run over the past 24hrs. On an hourly chart, the bullish pressure was suppressed by the 21 day MA that continuously gravitated above the 7 day MA that indicated an intense bearish outlook. дальше »
2019-7-17 17:11 | |
|
|
Weekly chart of Bitcoin is dazed but John McAfee remains unfazed
The cryptocurrency tide changes very fast. At one moment, the market would be projecting signs of a clear bullish run and the next moment, a shift in trend would take over. The virtual assets do not guarantee any consistent trading and most of the time, investors buy into the market due to “FOMO”. дальше »
2019-7-15 20:30 | |
|
|
Binance coin leads the up/down capture chart among major coins; Ethereum brings up the rear
As crypto-users wait for a bull run followed by an alt-season, Jeff Dorman, Chief Investment Officer [CIO] of Arca, a full-service investment management firm, has suggested another way to look at the performance aspect of individual cryptos. дальше »
2019-7-13 20:30 | |
|
|
Bitcoin Drops $2,000 in Minutes: Crypto Exchanges Struggle to Run Amid Volatility
What. The. Hell. In the past few minutes, Bitcoin (BTC) has slipped, showing an uncharacteristic bout of weakness in a massive uptrend. In fact, within the span of a few minutes, seconds maybe, Bitcoin fell from $13,800 — a year-to-date high — to just under $12,000. дальше »
2019-6-27 00:12 | |
|
|
Is $500k Bitcoin a Pipe Dream? This Chart Says Absolutely Not; Here’s Why
Bitcoin investors were pleased to find yesterday that BTC’s bulls have come out swinging and are now pushing the cryptocurrency’s price towards the psychologically critical price level of $10,000, which is just a hair above its current price. дальше »
2019-6-22 01:00 | |
|
|
Bitcoin exhibits similar trends to pre-2017 bull run era; can history repeat itself?
Bitcoin prices have stomped past another major price resistance as the coin crossed the $9000 valuation in the market. At press time, the virtual asset breached past another major resistance of $9200, and the market cap stood at 165. дальше »
2019-6-17 19:30 | |
|
|
This Cryptocurrency Price Chart is Making Pre Parabolic Set Ups
Bitcoin is famous for its parabolic rise that drives the speculators’ interest in the world’s top cryptocurrency. This parabolic curve was what drove BTC to $20,000 during the last bull run and can further take it to as high as $1 million in the future. дальше »
2019-6-10 19:14 | |
|
|
Neo (NEO) Price Analysis And Prediction for 2019 and Beyond – NEO Made A Solid Run But Beware Of The Forming Reversal Signs (June 1st Update)
4H NEOBTC In our last update, we stated that NEO needs to break the 155k height before it can fly up to 170k, which it did. However, it quickly got rejected at this height and fell down to Fib618 at 163k. дальше »
2019-6-1 14:50 | |
|
|

Technicals Showing Bitcoin (BTC) Clearly Entered Overarching Bull Trend
Historical Bull Run Triggers Bitcoin (BTC) may be a new paradigm in finance, technology, and human psychology, but its chart remains cyclical and rife with patterns, much like almost every other asset in circulation. дальше »
2019-6-1 05:30 | |
|
|
Binance Coin (BNB) Price Analysis And Prediction 2019 – Can BNB Do Another Rally While The Rest Of The Market Goes Down (May 31st Update)
4H BNBBTC Summary of the last couple of weeks: 4H chart depicts a massive bull run of BNB against bitcoin. BNB ranged around 325k and the Fib236 (April high, May low) before moving up to the Fib382 at 355k and hanging around it for a while. дальше »
2019-5-31 04:59 | |
|
|
Binance Coin (BNB) Price Analysis And Prediction 2019 – BNB Did Its Pullback, Time For Another Swing High? (May 28th Update)
4H BNBBTC Summary of the last couple of weeks: 4H chart depicts a massive bull run of BNB against bitcoin. BNB ranged around 325k and the Fib236 (April high, May low) before moving up to the Fib382 at 355k and hanging around it for a while. дальше »
2019-5-28 13:25 | |
|
|

Bitcoin Price Cools Off in Preparation for a Push Above $9,000
After swiftly gaining 10. 7% in less than 24-hours, Bitcoin reached a new 2019 high and is a mere $1,200 away from the all-important $10,000 valuation. Bitcoin Price: Market Overview Bitcoin hit $8,947 on Coinbase and to date has gained 143%. дальше »
2019-5-28 01:00 | |
|
|
VeChain (VET) Price Analysis and Prediction 2019 – Hanging In A Limbo (May 25th Update)
4H VETBTC VeChain has been underperforming lately, especially if we juxtapose its performance with some of its nearby coins on the market rankings. It did have its own mini bull run last week, but the correction phase has prolonged its duration to the great sorrow of VET holders. дальше »
2019-5-25 14:02 | |
|
|
Binance Coin (BNB) Price Analysis And Prediction 2019 – BNB Is The Best Altcoin To Own These Days (May 25th Update)
Mid May Update: Technicals 4H BNBBTC 4H chart depicts a massive bull run of BNB against bitcoin. BNB ranged around 325k and the Fib236 (April high, May low) before moving up to the Fib382 at 355k and hanging around it for a while. дальше »
2019-5-25 02:00 | |
|
|

Ripple (XRP) Payments Near All-Time-Highs of Dec 2017
A live XRP chart provided by Ripple shows that XRP payments have been on the rise and are nearing to reach highs only seen during the bull run in 2017. The post Ripple (XRP) Payments Near All-Time-Highs of Dec 2017 appeared first on Ethereum World News. дальше »
2019-5-24 11:06 | |
|
|
Ravencoin (RVN) Price Prediction 2019 – Lost Steem And Fell Into A Flat Market (May 23rd Update)
Mid May Update: Technicals 4H RVNBTC RVN is in a trendless ranging (minor trend) hovering around a confluence point of Fib382 and EMA20 on the 4 hour chart. It seems that the whole market is waiting for bitcoin’s next move so alts are essentially run by bots that play it safe with small dips and […] The post Ravencoin (RVN) Price Prediction 2019 – Lost Steem And Fell Into A Flat Market (May 23rd Update) appeared first on CaptainAltcoin. дальше »
2019-5-24 19:28 | |
|
|
VeChain (VET) Price Analysis and Prediction 2019 – A Mini-Bull Run Looms On The Horizon? (May 22nd Update)
Mid May Update: Technicals 4H VETBTC VeChain has been underperforming lately, especially if we juxtapose its performance with some of its nearby coins on the market rankings. It did have its own mini bull run last week, but the correction phase has prolonged its duration to the great sorrow of VET holders. дальше »
2019-5-22 04:54 | |
|
|
Binance Coin (BNB) Price Analysis And Prediction 2019 – BNB Bull Run Stops Around 403k or 440k? (May 21st Update)
Mid May Update: Technicals 4H BNBBTC 4H chart depicts a massive bull run of BNB against bitcoin. BNB ranged around 325k and the Fib236 (April high, May low) before moving up to the Fib382 at 355k and hanging around it for a while. дальше »
2019-5-21 19:49 | |
|
|
Neo (NEO) Price Prediction for 2019 and Beyond – Needs To Crack 157k For A Full Blown Bull Run (May 21st Update)
Mid May Update: Technicals 4H NEOBTC The 4H chart shows NEO dancing around a crucial height of 149k which is a junction point of EMA20 and Fib618. Closing a daily candle above the breakout zone of 157k at Fib236 (April-May high lows) and Fib786 (recent May highs and lows) would be a clear indicator of […] The post Neo (NEO) Price Prediction for 2019 and Beyond – Needs To Crack 157k For A Full Blown Bull Run (May 21st Update) appeared first on CaptainAltcoin. дальше »
2019-5-21 18:00 | |
|
|
Tron (TRX) Price Analysis and Prediction 2019 – Shy Bullish Hints Spotted on The Chart (May 21st Update)
Mid May update: Technical analysis 4H TRXBTC You can see a clear trendless ranging on 4hr timeframe after TRX bottomed out at 306 satoshis and launched a mini bull run, to the local high of 404 sats. дальше »
2019-5-21 04:43 | |
|
|
Ethereum Classic (ETC) Price Analysis And Prediction 2019 – Sustaining The 95k Sats Level Is Critical For The Bull Run (May 20th Update)
Mid May Update: Technicals 4H ETCBTC On the 4 hour chart, ETC is in a near-term bull trend fighting to hold an important level of 95000 satoshis – this is a Fibonacci 236 level that was the first stop for ETC in the initial jump from the recent bottoms. дальше »
2019-5-20 01:40 | |
|
|