Новости о Resistance Past [ Фото новости ] [ Свежие новости ] | |


Ethereum Price: Consolidating For The Next Leg Up?
On Friday Litecoin kickstarted a phenomenal rally which led the entire market higher. Can Ethereum continue to gain on its own or will Bitcoin and Litecoin price action mirror Ethereum’s future course? Ethereum Price: Market Overview Ethereum and Litecoin both staged amazing rallies over the past few days. дальше »
2019-2-10 14:00 | |
|
|
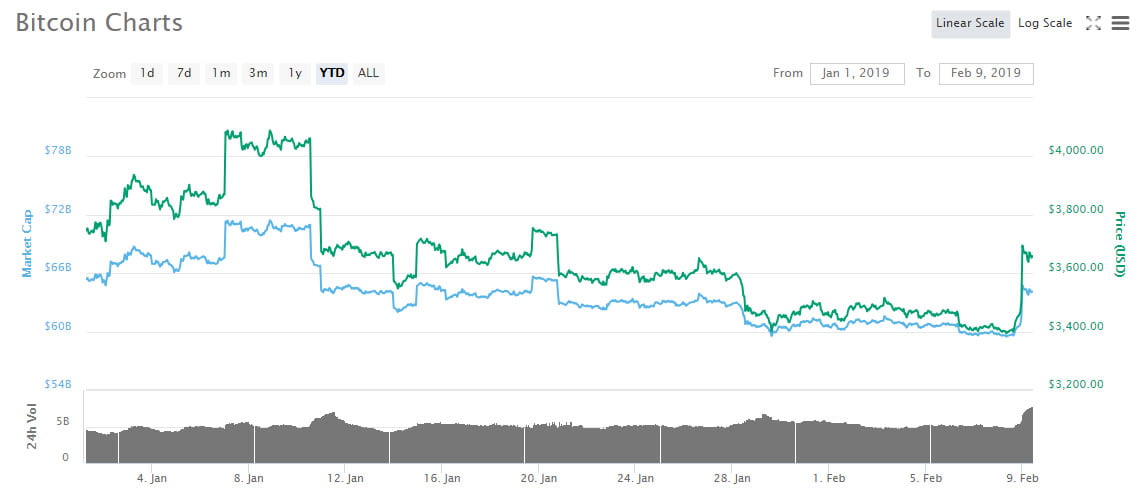
GalaxyBTC Crypto Analyst Thinks February 8, 2019 Could Be the Start of a Bitcoin Bull Market Rally
Earlier today, the price of Bitcoin witnessed a surge of over 10%– thereby allowing the premier alt-currency to break through its stubborn resistance region of $3,480-3,500. This sudden increase came after weeks of stagnancy, which saw the flagship asset dip to record lows over the course of the past year or so. However, the question […] дальше »
2019-2-9 18:41 | |
|
|

Bitcoin Price Analysis: Strong Rally Set to Test Overhanging Resistance
Shortly after the London Open, the entire crypto market saw a strong round of buying. Some coins broke their highest volume seen since the beginning of the bear market, and several others broke straight through overhanging resistance levels. дальше »
2019-2-9 01:45 | |
|
|
Ethereum Price Analysis: ETH Rebounds at $102.99 and Returns to Resistance at $106.99 – Can the Bulls Continue to Drive the Rebound Higher?
Latest Ethereum News The Ethereum market has continued to struggle over the past few days as price action continues… The post Ethereum Price Analysis: ETH Rebounds at $102. 99 and Returns to Resistance at $106. дальше »
2019-2-8 13:08 | |
|
|
Ethereum Price Analysis: ETH’s Next Leg Lower Underway
ETH price failed to move past the $105 resistance and later declined against the US Dollar. Yesterday’s highlighted crucial bearish trend line is intact with resistance near $104 on the hourly chart of ETH/USD (data feed via Kraken). дальше »
2019-2-8 07:08 | |
|
|
Litecoin Price Action: LTC Trades Tightly Between Key Moving Averages
Litecoin has been the top performing major cryptocurrency over the past seven days. Data from Messari show Litecoin increasing 10% in price over the past seven days. If Fibonacci retracement levels are drawn from the December low to the January, we can see that price has been meeting resistance at the 0. дальше »
2019-2-5 18:24 | |
|
|
TRON Price Analysis: TRX Continues to Be the Strongest Performing Cryptocurrency in the Top 20 Over the Past Month
Support for TRX moving forward: $0.02681, $0.02510, $0.02402, $0.02122, $0.020, $0.01725. Resistance for TRX moving forward: $0.02739, $0.02855, $0.03027,… The post TRON Price Analysis: TRX Continues to Be the Strongest Performing Cryptocurrency in the Top 20 Over the Past Month appeared first on Invest In Blockchain. дальше »
2019-2-5 16:01 | |
|
|
Bitcoin Price at $1,800? The Longest Bear Market in History Could End With a Spiraling Collapse
Throughout the past 4 days, since February 1, the crypto market has remained stable at around $114 billion as the Bitcoin price stabilized at $3,500. Several analysts expected Bitcoin to recover beyond the $4,000 resistance level after rebounding from the low $3,300 region. дальше »
2019-2-5 14:20 | |
|
|
Tron Technical Analysis: TRX Price Falls but Remains Above 200-Day Moving Average for Now
After outperforming for the past few weeks, Tron is forming more bearish patterns with lower lows and lower highs forming. Bullish conditions last week brought the price of Tron above resistance at $0. дальше »
2019-1-31 19:09 | |
|
|
Bitcoin [BTC] Price Action: Lower High Forms for Bitcoin
The cryptocurrency market experienced a brief recovery yesterday after starting the week with bearish movements. The market leader Bitcoin returns to bearish movements today after meeting resistance at $3476. дальше »
2019-1-31 18:44 | |
|
|
South Korean cryptocurrency exchanges pool data to counter money launderers
Laundering funds with cryptocurrencies in South Korea could soon become a thing of the past if four of the country’s exchanges have their way. According to a local media report, Bithumb, Upbit, Corbit and Coinone have cobbled together to share ‘real-time’ wallet information on any suspicious activity linked to phishing attempts and pyramid schemes. дальше »
2019-1-28 20:10 | |
|
|
TRON Price Prediction: How Long Will TRX Continue the Rally?
Long-Term Outlook A look at the Weekly chart for TRX shows that price is following a descending support line. After bouncing in December, the price has moved past the 7-period moving average and is now headed for the $0. дальше »
2019-1-26 20:49 | |
|
|
Bitcoin Price Analysis: Strong Move Likely Following Tightly Coiled Market
Days and days of sideways consolidation and tightening volume has been the name of the game for the bitcoin market. A narrow range of $200 has caused a weeks worth of activity to coil and consolidate in preparation for bitcoin’s next move:Figure 1: BTC-USD, Daily Candles, Narrow RangeThe figure above shows just how narrow the range has been over the last week as the market has continued to grind out support and fail to break above overhanging resistance. дальше »
2019-1-26 03:13 | |
|
|
Dogecoin Price Analysis: Value of Doge Remains in a Range
Dogecoin followed the markets movements over the weekend but failed to break outside of the range it has been trading in for the ten days. The range has a lower support level of $0. 002 and a resistance level at $0. дальше »
2019-1-21 19:49 | |
|
|
Ethereum (ETH) Prices Take A Dip As The Constantinople Hard Fork Is Delayed For Another Couple Of Weeks
On Saturday 19, the market lit up in green seeing the recent price stalemate broken off. A majority of coins begun surging with the crypto leader breaking past the $3,700 resistance level. This crucial break meant altcoins breaking through short-term resistance position. дальше »
2019-1-21 19:35 | |
|
|
Bitcoin: After Breaking Above $3,700 It Could Soon Surge Towards $4,100, Says Analyst
After a several day period with little volatility in the cryptocurrency markets, Bitcoin has now surged above $3,700, which proved to be a level of resistance over the past week. Today’s price surge, despite being relatively small, could be significant in leading Bitcoin’s price back towards $4,100. дальше »
2019-1-19 23:00 | |
|
|
Bitcoin [BTC] Price Set to Retest Resistance Despite Other Top Cryptocurrencies Falling
Bitcoin has been proving once again that it holds its value best in questionable market times. Bitcoin price has been making movements back up to test $3684 despite other, major cryptocurrencies trading further away from significant levels. дальше »
2019-1-18 19:44 | |
|
|
Bitcoin Price Analysis: Bitcoin Tests Boundary Support as Demand Weakens
Following last Friday’s drop, bitcoin has found itself coiled, once again, at the bottom of the range it established back in December. With the current market unable to close a new high, the market finds itself in a precarious position:Figure 1: BTC-USD, Daily Candles, Range Support TestThe blue support level shown above illustrates the boundary of the multi-week range bitcoin has been bound by. дальше »
2019-1-18 02:02 | |
|
|
Bitcoin Price Watch: Bitcoin May Need More Regulation if It’s to Succeed
At press time, the father of crypto is still trading in the $3,600 range, suggesting there’s been little change over the past week. Bitcoin has developed comfort in its present position, which is annoying (and disheartening) to the rest of us. дальше »
2019-1-15 00:23 | |
|
|
Dogecoin [DOGE] Price Analysis – Doge Enters Range After Descending Triangle Pattern
After a bearish end to last weeks trading, the market has begun spiking over the past hour. Many major cryptocurrencies are rising to key levels and finding resistance. Doge declined from a descending triangle pattern yesterday to reenter what has been an important range for the meme-based cryptocurrency. дальше »
2019-1-14 19:29 | |
|
|
Ethereum Price Weekly Analysis: ETH Could Accelerate Losses Below $121
ETH price declined heavily this past week below the $146 and $130 supports against the US Dollar. There is a crucial bearish trend line formed with resistance at $138 on the 4-hours chart of ETH/USD (data feed via Kraken). дальше »
2019-1-13 08:18 | |
|
|
Litecoin (LTC) Daily Price Forecast – January 10
LTC/USD Medium-term Trend: Ranging Resistance Levels: $66, $68, $70 Support Levels: $35, $33, $31 Yesterday, January 9, the price of Litecoin was in a bullish trend. The price of Litecoin fell to the 26-day EMA after failing to break the resistance at $40. дальше »
2019-1-10 09:33 | |
|
|
Tron (TRX) Rally Looks Real, Price Could Test $0.0350
Tron price rallied recently and broke the $0. 0220 and $0. 0250 resistance levels. TRX remains well supported on the downside and it could move past $0. 0300 and $0. 0320. Key Talking Points Tron price made a nice upward move and broke the $0. дальше »
2019-1-9 09:45 | |
|
|
Bitcoin (BTC) Price Analysis: Another Attempt to Break Higher
Bitcoin is still stuck in consolidation for yet another day, but bulls are finding hope in the fact that price was able to hold its head above $4,100 again. Besides, another attempt to break past the near-term resistance appears underway. дальше »
2019-1-9 06:31 | |
|
|
Cardano (ADA) Price Analysis: Major Reversal Pattern Formed
Cardano could be due for a huge reversal from its previous long-term slide as an inverse head and shoulders pattern has formed on its 4-hour time frame. Price has yet to break past the neckline resistance at the 0. дальше »
2019-1-8 07:27 | |
|
|
Crypto Analyst: Bitcoin (BTC) Hitting “Titanium” Resistance, Bottom Not In
Crypto Market Encountering “Titanium Level” Resistance As reported by Ethereum World News previously, on Sunday, Bitcoin (BTC) suddenly surged past $4,000 the first time since Christmas Eve, as buying pressure quickly pushed the asset higher in a seeming “flash flood. дальше »
2019-1-8 01:15 | |
|
|
Litecoin Surges Past Stellar as It Closes in on the Market Cap of EOS — Can the Buyers Race Higher Towards the $45 Handle?
Litecoin has recently surged, breaking above Stellar’s market cap value. The LTC market has broken above the previous resistance… The post Litecoin Surges Past Stellar as It Closes in on the Market Cap of EOS — Can the Buyers Race Higher Towards the $45 Handle? appeared first on Invest In Blockchain. дальше »
2019-1-7 19:59 | |
|
|
Litecoin [LTC] Leads the Crypto Market As Its Price Bullishly Breaks Through Resistance
There have been occasions in the past where Litecoin has led the rest of the cryptocurrency market. This could be the case currently with Litecoin leading the market despite other major cryptocurrencies not following suit. дальше »
2019-1-6 18:19 | |
|
|

Tron [TRX] Price Prediction – After Reaching Resistance, What Will Happen Next?
A look at the 3-day chart for TRX shows that price has moved past the 7 and 21 period moving averages and is currently in the area of resistance formed by the highs of August and October 2018. Price is also facing resistance from the cloud. дальше »
2019-1-6 22:08 | |
|
|
Crypto Markets Drop Slightly, Further Losses May Be Needed to Spark Rally
The crypto markets have extended yesterday’s losses into today, with most major cryptocurrencies trading down slightly at the time of writing. Bitcoin and Ethereum have both established levels of resistance over the past few days and are continuing to respect those levels. дальше »
2019-1-5 23:00 | |
|
|
Bitcoin Price Analysis: Range-Bound Market Coiled for Next Move
For the better part of a month and a half, bitcoin has been fairly range-bound and unable to establish new lows or new highs. There are some bullish and bearish setups on the horizon for bitcoin, so let’s check out both sides of the argument because currently the market is sitting in the middle of Indecisionville — the most immediate sign of which is this glaringly obvious head-and-shoulders bottom reversal pattern:Figure 1: BTC-USD, Daily Candles, Head-and-Shoulders BottomThis current pattern is nothing more than a setup at the moment, but it represents one potential outcome of this sustained consolidation. дальше »
2019-1-4 02:22 | |
|
|
Bitcoin (BTC) Price Analysis: Larger Reversal Pattern Forming
Bitcoin might be ready for a longer-term climb as it forms an inverse head and shoulders pattern on its 4-hour time frame. Price has yet to test and break past the resistance but if it does, bitcoin could be in for a climb that’s the same height as the chart formation. дальше »
2019-1-2 05:10 | |
|
|
MONERO (XMR) Daily Price Forecast – December 31
XMR/USD Medium-term Trend: Ranging Resistance levels: $52, $56, $60 Support levels: $40, $36, $32 On December 28, XMR/USD lost momentum to sustain past its 50-day SMA’s trend-line. Just about then, the crypto has been majorly experiencing lower lows underneath the indicator’s trend-line. дальше »
2018-12-31 16:57 | |
|
|
Bitcoin [BTC] Showing Great Stability Amidst Bearish Pressure
Throughout the festivity, bitcoin has remained stable, securing a support position above $3,600 and resistance position a little over $3,800. Although the coin has in several instances over the past couple of days rallied to hit $4,000, price corrections have seen the coin settle on the $3,800 position. дальше »
2018-12-28 14:26 | |
|
|

Bitcoin Price Analysis: Strong Rally Tests Overhanging Resistance
Earlier this week, bitcoin enjoyed a strong and quick rally, spanning all the way from the low $3,100s to the upper $3,900s — in other words, a move that previously took the market weeks to make, this time took place in just a few short days. дальше »
2018-12-20 02:21 | |
|
|

Ripple’s XRP Surges to Meet Key Resistance Area, Can it Continue Higher?
Ripple’s XRP started the week surging above the range it had formed from $0.29 to $0.31. It continued past resistance at $0.35 and currently trades around $0.38. $0.39 to $0.4 is the next important area to monitor, being an area of significant trading activity in the past and also being at a key psychological point for […] Ripple’s XRP Surges to Meet Key Resistance Area, Can it Continue Higher? was originally found on [blokt] - Blockchain, Bitcoin & Cryptocurrency News. дальше »
2018-12-19 18:19 | |
|
|
Bitcoin Price Analysis: Bear Pennant Breakout Puts $1,700 Price in Sight
Another week, another low. Bitcoin’s market has been bleeding relentlessly for weeks and now, after falling 50% in value in just one month, the market has managed to break south of a major bearish consolidation pattern called a bear pennant:Figure 1: BTC-USD, 4-Hour Candles, Bear Pennant BreakoutThis is a massive bear pennant with a staggering $2,000 measured move. дальше »
2018-12-12 01:52 | |
|
|
MONERO (XMR) Daily Price Forecast – December 10
XMR/USD Medium-term Trend: Ranging Resistance levels: $52. 50, $57. 50, $62. 50 Support levels: $40, $35, $30 Noticeably, XMR/USD market had declined southwards last week to break down the range within which it ranged on December 5 to feebly touch past the $42. дальше »
2018-12-10 17:06 | |
|
|
Crypto Market Update: Stellar (XLM), Bitcoin Cash, Tron (TRX), ADA Price Analysis
Key Points The total crypto market cap recovered above $105. 00B, but struggled near $113. 00B. Stellar (XLM) price is up around 2%, but it is facing sellers near $0. 1250. Bitcoin cash price is back above the $100 level and it could correct towards $115. дальше »
2018-12-10 09:00 | |
|
|
Bitcoin Price Analysis: Wait and See Where Recent Signs of Strength Lead
This week realized a big gain as bitcoin enjoyed a 25% rally from its local bottom before topping out around $4,400. Support currently appears to be established in the mid-$3,000s as the market remains indecisive over its next move:Figure 1: BTC-USD, Daily Candles, Current Support LevelFigure 1 shows the relevance of the current support level as it represents a previous support level that was never properly retested during last year’s parabolic bull market. дальше »
2018-11-30 01:45 | |
|
|
Bitcoin (BTC) Price Analysis: More Buyers Waiting For This Retest
Bitcoin broke out of its descending channel on the 1-hour time frame to signal that a reversal is due. Price also moved past its double bottom to confirm that an uptrend is underway, but resistance around the $4,400 level held. дальше »
2018-11-29 05:11 | |
|
|
Bitcoin (BTC) Price Analysis: Bulls Are Back in the Game!
Bitcoin was previously trending lower inside a descending channel but has just broken past the resistance to indicate that a reversal is due. Price has also closed above the 100 SMA dynamic inflection point as an additional bullish signal. дальше »
2018-11-28 08:30 | |
|
|
Ripple’s XRP Price Meets Resistance Amid Bearish Market Conditions
The bearish events of the past week have resulted in Ripple’s XRP becoming the largest altcoin by market cap and the second largest cryptocurrency by market cap, with Bitcoin the largest. This was the result of XRP outperforming the majority of altcoins while the market was declining and also while it was recovering. дальше »
2018-11-22 14:19 | |
|
|
Bitcoin [BTC] Price Returns to Resistance
The past week has been extremely bearish for the price of Bitcoin. Bitcoin broke below several key support levels with strong seller momentum. Since pricing in a low below $4200 on Tuesday, Bitcoin has started recording more bullish movements as it rises back up. дальше »
2018-11-22 12:54 | |
|
|
Bitcoin Price Analysis: Another Red Day Pushes BTC Into Deeper Support Test
Bitcoin has tumbled again today as the market continues to see further downward movement shortly after breaking two areas of market support. So far, bitcoin is down 15% on the day — 25% in 1 week:Figure 1: BTC-USD, Daily Candles, Downward ContinuationThis drop below support is starting to display hallmarks of market capitulation. дальше »
2018-11-20 02:27 | |
|
|

Stellar [XLM]: Possible Ascending Triangle?
On the 3-day chart, Stellar has been moving above strong support (green line) for the past 240 days. In early November we had the first bullish MA cross in more than a year (9-day SMA crosses 26-day SMA), but the price quickly hit resistance at both the cloud and the 100-day SMA on November 13 […] Stellar [XLM]: Possible Ascending Triangle? was originally found on [blokt] - Blockchain, Bitcoin & Cryptocurrency News. дальше »
2018-11-17 15:29 | |
|
|
Ethereum Price Analysis: ETH Reaches Resistance at the Upper Boundary of a Triangle — Can the Bulls Break Above?
Ethereum has seen a recent price surge totaling over 10% over the past week of trading. The market is… The post Ethereum Price Analysis: ETH Reaches Resistance at the Upper Boundary of a Triangle — Can the Bulls Break Above? appeared first on Invest In Blockchain. дальше »
2018-11-8 07:49 | |
|
|