Новости о Resistance Close [ Фото новости ] [ Свежие новости ] | |

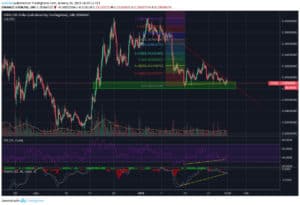
Binance Coin [BNB] Price Prediction: Does the Bearish Divergence Mean That We Just Made a Double Top?
Long-Term Outlook A look at the Weekly chart for BNB in logarithmic form shows that price is trading at $7, very close to the 7-period MA and the previous resistance area at $7. 5-$8. 5. The nearest support area can be found at $4. дальше »
2019-2-5 14:39 | |
|
|
Bitcoin Price Action – BTC Continues in a Range to Start the Week
Bitcoin continues in the range it has been trading in to start this week. Last week started with a bearish movement that brought price between support at $3353 and resistance at $3476. Today’s candle is currently forming a Doji. дальше »
2019-2-4 18:59 | |
|
|
Ethereum Price Prediction: Did We Reach the Bottom or Is There Another Drop in Store?
Long-Term Outlook: A look at the Weekly chart for Ethereum in logarithmic form shows that after breaking down through the $180 support, the price is trading at $109, below the 7,21,50 period moving averages and the Ichimoku cloud. дальше »
2019-2-3 16:44 | |
|
|
XRP, Dogecoin, XLM, IOTA, Monero, Dash, Neo, Tron: Price Predictions, Feb 2
XRP Price Analysis: A look at the Daily chart for XRP shows that price is very close to the $0. 26-$0. 28 support area, currently trading at $0. 31. Price is trading below the 7, 21, 50 and 200-period moving averages and the Ichimoku cloud and is facing very close resistance from the 7-period MA. дальше »
2019-2-2 16:34 | |
|
|
Bitcoin Price: Doji Candle Forming for BTC Today
Bitcoin met resistance at $3476 during a brief recovery from the bearish start to the week. The price has since started to trade away from the $3476 resistance and is currently forming a Doji candle. дальше »
2019-2-1 19:04 | |
|
|
Litecoin [LTC] Price Prediction: Will the Third Attempt at Breaking Resistance Be Successful?
Long-Term Outlook A look at the Weekly chart for Litecoin in logarithmic form shows that the price is very close to the support area of $25-$30 formed by the highs of 2014, currently trading at $32. дальше »
2019-1-30 17:24 | |
|
|
Bitcoin (BTC) Price Analysis: Channel Support Bounce, Next Targets
Bitcoin found support at the bottom of its descending channel on the 1-hour time frame and looks due for a pullback to the top. Applying the Fibonacci retracement tool shows the next potential resistance levels. дальше »
2019-1-29 04:16 | |
|
|
Price Predictions for the Top 5 Penny Cryptocurrencies: XRP, XLM, TRX, ADA & IOTA
XRP Price Prediction and Analysis: A look at the Weekly chart for XRP shows that price is very close to the major support area at $0. 30. Price is trading below the 7 and 21 period moving averages. дальше »
2019-1-26 17:09 | |
|
|

Bitcoin Price Analysis: Strong Move Likely Following Tightly Coiled Market
Days and days of sideways consolidation and tightening volume has been the name of the game for the bitcoin market. A narrow range of $200 has caused a weeks worth of activity to coil and consolidate in preparation for bitcoin’s next move:Figure 1: BTC-USD, Daily Candles, Narrow RangeThe figure above shows just how narrow the range has been over the last week as the market has continued to grind out support and fail to break above overhanging resistance. дальше »
2019-1-26 03:13 | |
|
|
Bitcoin (BTC), Ethereum (ETH), and XRP (Ripple) Top Coin Price Watch (January 25)
Bitcoin BTC/USD Price Analysis Yesterday the price of Bitcoin was $3590 at its lowest point from where an increase has been made to $3666 but since the price encountered resistance at those levels it came back down and is currently sitting at $3604 which is close to the level of yesterday’s low. Looking at the […] дальше »
2019-1-26 00:00 | |
|
|
TRX Price Analysis: Tron Continues Outperformance as Resistance Approaches
With the exception of Bitcoin Cash, the price of Tron has appreciated the most out of the top ten cryptocurrencies today. The price pattern forming for Tron continues to be bullish with its price successfully forming a higher high. дальше »
2019-1-23 19:44 | |
|
|
XRP Price Prediction: Approaching the End of the Symmetrical Triangle
Long-Term Outlook A look at the Weekly chart for XRP shows that price is currently trading at $0. 32, close to the long-standing support area at $0. 3. Price is facing very close resistance from the 7-period moving average and is also below the Ichimoku cloud. дальше »
2019-1-22 15:04 | |
|
|
Bitcoin [BTC] Price Analysis: Bear Flag Forming for Bitcoin
The week wrapped up with bearish movements yesterday for the cryptocurrency markets. Bitcoin recorded bullish movements on Saturday as it rose above a key resistance level at $3684. However, price failed to close above and fell back below before Saturday’s daily candle finished. дальше »
2019-1-21 18:34 | |
|
|
Bitcoin Price Analysis: Bitcoin Tests Boundary Support as Demand Weakens
Following last Friday’s drop, bitcoin has found itself coiled, once again, at the bottom of the range it established back in December. With the current market unable to close a new high, the market finds itself in a precarious position:Figure 1: BTC-USD, Daily Candles, Range Support TestThe blue support level shown above illustrates the boundary of the multi-week range bitcoin has been bound by. дальше »
2019-1-18 02:02 | |
|
|
Stellar [XLM] Price Prediction: Price Broke Out of the Descending Wedge, What Is Next?
Long-Term Outlook A look at the Weekly chart for Stellar in logarithmic form shows that price broke the long-standing support line at $0. 2 in mid-November and is now close to the first major support area in $0. дальше »
2019-1-17 20:27 | |
|
|
Bitcoin SV Price Analysis: BSV/USD Trends of January 16–22, 2019
CoinSpeaker Bitcoin SV Price Analysis: BSV/USD Trends of January 16–22, 2019 In case the support level of $73 holds the coin will break up the $80 resistance level and the bullish candle close above it, then it may have its target at $85 - $92, else further declination of Bitcoin SV price is certain. дальше »
2019-1-16 15:18 | |
|
|
Crypto Market Gains Traction: EOS, Tron (TRX), Bitcoin Cash, ADA Price Analysis
The total crypto market cap found support near $112. 00B and recovered above $120. 00B. EOS price is up more than 8% and it may extend gains above the $2. 50 resistance. Bitcoin cash price is back above the $130 level and it could test the $135 and $138 resistances. дальше »
2019-1-15 09:00 | |
|
|
Tron [TRX] Price Prediction & Analysis: Price Is Close to Support, Does It Have Strength for Another Rally?
Long-Term Outlook A look at the Weekly chart for TRX shows that price is following a descending support line and currently trading at $0. 023. Price rallied until $0. 04 where it found resistance corresponding with the 21 period moving average and promptly reversed. дальше »
2019-1-14 16:19 | |
|
|
Bitcoin Price Analysis: Range-Bound Market Coiled for Next Move
For the better part of a month and a half, bitcoin has been fairly range-bound and unable to establish new lows or new highs. There are some bullish and bearish setups on the horizon for bitcoin, so let’s check out both sides of the argument because currently the market is sitting in the middle of Indecisionville — the most immediate sign of which is this glaringly obvious head-and-shoulders bottom reversal pattern:Figure 1: BTC-USD, Daily Candles, Head-and-Shoulders BottomThis current pattern is nothing more than a setup at the moment, but it represents one potential outcome of this sustained consolidation. дальше »
2019-1-4 02:22 | |
|
|
EOS: Will the Support Area Hold and Are We Rallying Back to Previous Resistance?
A look at the 3-day chart in logarithmic form shows that price broke the long-standing support at $4 and promptly fell to the main area of support close to $1. 5. A quick rally ensued, and the price is now trading at around $2. дальше »
2018-12-28 13:14 | |
|
|
Ethereum Price Analysis: ETH Corrects Sharply, Can It Hold 100 SMA?
Key Highlights ETH price traded above the $150 and $154 resistance levels before correcting lower against the US Dollar. Yesterday’s highlighted key bullish trend line was breached with support at $141 on the hourly chart of ETH/USD (data feed via Kraken). дальше »
2018-12-25 07:08 | |
|
|

Bitcoin Price Analysis: Strong Rally Tests Overhanging Resistance
Earlier this week, bitcoin enjoyed a strong and quick rally, spanning all the way from the low $3,100s to the upper $3,900s — in other words, a move that previously took the market weeks to make, this time took place in just a few short days. дальше »
2018-12-20 02:21 | |
|
|
EOS, Tron (TRX), Litecoin (LTC), Stellar Lumens (XLM), Cardano (ADA) Price Analysis
Losses are steep in EOS and this is partly because of block producer centralization claims and the uncertainty around Dan Larimer commitment. But while we expect bears to slow down, Tron is stable and up 22 percent in the last week. дальше »
2018-12-5 07:00 | |
|
|
Bitcoin Cash SV (BCHSV) Daily Price Forecast – November 22
BCHSV/USD Medium-term Trend: Ranging Supply zones: $80, $90, $100 Demand zones: $30, $20, $10 BCHSV remains in a range-bound market in its medium-term outlook. $50.00 in the supply area was the high the bullish pressure could take the coin as it faced resistance around the 10-EMA with the close of the candle as a […] дальше »
2018-11-22 09:03 | |
|
|
Bitcoin Price Watch: BTC/USD Could Recover Toward $4,800
Key Points Bitcoin price extended losses and traded close to the $4,000 support against the US Dollar. There was a break above a major bearish trend line with resistance at $4,451 on the hourly chart of the BTC/USD pair (data feed from Kraken). дальше »
2018-11-21 12:30 | |
|
|
Ethereum Price Analysis: ETH/USD Consolidating Above $120 Support
Key Highlights ETH price declined heavily and traded close to the $120 support level against the US Dollar. Yesterday’s highlighted key bearish trend line is intact with resistance at $138 on the hourly chart of ETH/USD (data feed via Kraken). дальше »
2018-11-21 09:28 | |
|
|
Bitcoin Cash Price Analysis: BCH/USD Recovery Faces Hurdle Near $280
Key Points Bitcoin cash price declined further and traded close to the $200 support against the US Dollar. This week’s followed important bearish trend line is still in place with resistance at $280 on the hourly chart of the BCH/USD pair (data feed from Kraken). дальше »
2018-11-21 07:28 | |
|
|
Bitcoin Price Weekly Analysis: Sell Rallies In BTC/USD Near $5,880
Key Points Bitcoin price declined heavily and traded close to the $5,200 support level against the US Dollar. There is a short term consolidation pattern formed with resistance at $5,550 on the 4-hours chart of the BTC/USD pair (data feed from Kraken). дальше »
2018-11-18 09:30 | |
|
|
Ethereum Price Analysis: Close Below $206 Could Be Destructive for ETH/USD
Key Highlights ETH price is facing a tough resistance near the $209. 00 and $210. 00 levels against the US Dollar. Yesterday’s highlighted major bearish trend line is intact with resistance at $209 on the hourly chart of ETH/USD (data feed via Kraken). дальше »
2018-11-13 11:28 | |
|
|
Bitcoin (BTC) Price Analysis: Key Resistance to Watch
Bitcoin volatility has been low once more, leading many to speculate that a big breakout might be brewing. Price is still keeping its head above a rising channel seen on the 4-hour time frame but has also formed lower highs and is below a shorter-term trend line. дальше »
2018-11-13 05:59 | |
|
|
IOT/USD Price Analysis: More than 600 Corporations Interested in IOTA
Like the rest of the market, IOT/USD aggressive traders can begin loading at spot thanks to Nov 4 close above the minor resistance trend line. But, the real impetus is the effort by the IOTA Foundation to create avenues where corporations can easily integrate and make use of Tangle. дальше »
2018-11-9 05:15 | |
|
|
Bitcoin Price Analysis: Weekly Consolidation Hints Toward Sustained Breakout
Another week has passed as bitcoin continues to coil in a tighter and tighter consolidation. Both price and volume continue to consolidate as bitcoin decides where the next major move will be. дальше »
2018-10-31 00:19 | |
|
|
Bitcoin Price Analysis For October Week 4 | BTC Remains Calm as Bulls Prepare to Storm
Summary The pair seemed to find resistance at the $6800 mark and support at the $6500 mark. A slow 0. 19% loss was registered throughout the week. The chart The BTC/USD pair was dominated by a bearish trend. дальше »
2018-10-27 00:52 | |
|
|
Bitcoin Cash Price Analysis: BCH/USD Turned Sell on Rallies Near $440
Key Points Bitcoin cash price declined further and traded close to the $420 support level against the US Dollar. There is a new bearish trend line in place with resistance near $435 on the hourly chart of the BCH/USD pair (data feed from Kraken). дальше »
2018-10-19 07:28 | |
|
|

Bitcoin Price Analysis: Bulls Defend Yearly Support Amidst Wall Street Slump
As Bitcoin price moves towards the second weekly close of October, we recap what happened during the week and look at the bullish versus bearish case for the number one cryptocurrency. 1 Day chart Bitcoin price has spent most of October in a tight range oscillating between lows of $6400 and highs of $6,650 as it continued a slow grind towards the horizontal resistance, which has capped the cryptocurrency’s price since January 2018. дальше »
2018-10-15 20:00 | |
|
|

Joe Crypto: Is Bitcoin Holding Us All Back?
It’s another muggy, close and humid day on the market as the pressure continues to build, but the crypto world is being physically restrained right now as Bitcoin wrestles with resistance points ranging from $6,500 to $7,000. дальше »
2018-10-11 00:37 | |
|
|
Cardano (ADA) Could Moonshot After Coinbase Listing
Chart for ADA/USD (1W) Cardano (ADA) is the cryptocurrency with the highest probability of being listed next on Coinbase. Cardano (ADA), which is supported by IOHK, is the firm run by Charles Hoskinson, the founder of Cardano (ADA). дальше »
2018-10-10 18:30 | |
|
|
Bitcoin (BTC) May Never See $6,000 Again
Chart for BTC/USD (1W) Bitcoin (BTC) is finally out of the woods. The above weekly chart for BTC/USD shows that Bitcoin (BTC) has formed a weekly candle above the historical downtrend line. This is the first time since January 2018 that Bitcoin (BTC) has breached this resistance line and formed a candle above it. дальше »
2018-10-10 00:30 | |
|
|
EOS Daily Price Forecast – October 5
EOS/USD Medium-term Trend: Bearish Resistance levels: $ 6.0, $6.5, $7.0 Support levels: $5.0, $4.5, $4.0 Yesterday, October 4, the price of EOS was in a bullish trend. The digital currency had been in a bullish trend all through yesterday and price reached the high of $ 5.84. The price of EOS was resisted close to […] дальше »
2018-10-5 11:21 | |
|
|
Bitcoin (BTC) Cannot Fall Below $5,800 Under The Bullish Case
Bitcoin (BTC) has to make a move by next week. The weekly chart for BTC/USD shows that Bitcoin (BTC) is about to close a weekly candle right next to the downtrend resistance. If this candle closes above the downtrend resistance, which is quite likely, we will see the beginning of a new cycle from next week. дальше »
2018-10-4 18:30 | |
|
|
Bitcoin Price Watch: Close Above $6,600 Could Lift Market Sentiment
Key Points Bitcoin price found support near $6,400 and bounced back against the US Dollar. Yesterday’s highlighted key bearish trend line is acting as a hurdle near $6,580-6,600 on the hourly chart of the BTC/USD pair (data feed from Kraken). дальше »
2018-10-4 12:28 | |
|
|
Cardano Price Analysis: Stellar Lumens and Litecoin Stabilizing the Altcoin Ship
In the last day, altcoin prices were stable. Gains or losses were within a one percent range as sellers begin to clip back gains. The fact that there is failure by Cardano and EOS bulls to close above key resistance lines at 12 cents and $7 backs our bearish forecast. дальше »
2018-10-3 04:00 | |
|
|
Bitcoin Price Analysis: Failure of Buyers to Close Above $7,000 is Bearish for BTC
After three weeks of bulls, Bitcoin prices are yet to breach the $6,800–$7,200 main resistance zone. With this, bears are in control as Sep 5 bearish pattern overshadow buy attempts. Remember, this is printing at the time when investors, market influencers and traders are “over the top bullish”. дальше »
2018-10-2 05:00 | |
|
|
Litecoin Price Analysis: LTC/USD Struggling Near Crucial Resistance
Litecoin price recovered recently from the $54. 30 support against the US Dollar. LTC/USD seems to be struggling to hold gains above the $60. 00 resistance. Key Talking Points Litecoin price is trading positively above the $55. дальше »
2018-9-27 11:11 | |
|
|
Ethereum Classic, Cardano, Tron, Monero, Ethereum Price Analysis September 24th
Altcoins are on a recovery backed by exchange listings, pure optimism and BTC correlation. However, even with the shifting sentiment, Cardano, Tron, ETC and Monero are yet to close above key resistance levels at 12 cents, 2. дальше »
2018-9-24 17:18 | |
|
|
Ethereum Price Analysis: ETH/USD Turned Super Bearish Below $240
Key Highlights ETH price declined heavily and broke the $260, $250 and $240 support levels against the US Dollar. This week’s followed crucial bearish trend line played well with resistance near $284 on the hourly chart of ETH/USD (data feed via Kraken). дальше »
2018-9-6 09:00 | |
|
|
Stellar (XLM) Awaits Breakout As Price Fails Again To Breach Resistance
Stellar (XLM) seems to be at a stage where it is just waiting for the rest of the market to recover. The weekly chart above for XLM/USD shows that the price has already closed four candles below the 21 Week EMA and could now close the fifth candle below the 21 EMA as well. дальше »
2018-9-6 00:30 | |
|
|

Bitcoin Price Analysis: All Eyes On $6800 Into The Monthly Close
As Bitcoin price approaches the Monthly candle close after a volatile day yesterday, we take a look at what’s going on in the market. 4 Hour Chart Looking that the daily chart, after closing the previous week at $6,700, Bitcoin began a bullish start to the week, trading at highs of $7,125 breaking the linear resistance by Tuesday. дальше »
2018-8-31 16:00 | |
|
|