Новости о Price Chart [ Фото новости ] [ Свежие новости ] | |

Bitcoin Cash Price Analysis: BCH/USD Primed To Break $530
Key Points Bitcoin cash price is trading with a positive structure above the $510 support against the US Dollar. There is an ascending channel in place with support at $520 on the hourly chart of the BCH/USD pair (data feed from Kraken). дальше »
2018-10-9 07:28 | |
|
|
EOS Price Watch: Bulls Setting Their Sights Higher
EOS Price Key Highlights EOS price recently busted through the top of its symmetrical triangle on the 4-hour chart to signal that a climb is taking place. Price is also trading inside a short-term ascending channel and may be aiming for the top around 6. дальше »
2018-10-9 06:59 | |
|
|
Ethereum (ETH)’s Final Showdown: Where To From Here?
Ethereum (ETH) is in a do or die situation. The above chart for ETH/USD shows that Ethereum (ETH) must break to the upside on the 4H timeframe for bullish momentum to hold. If the price breaks below the symmetrical triangle, there is a high probability that it will test the support again. дальше »
2018-10-8 20:00 | |
|
|
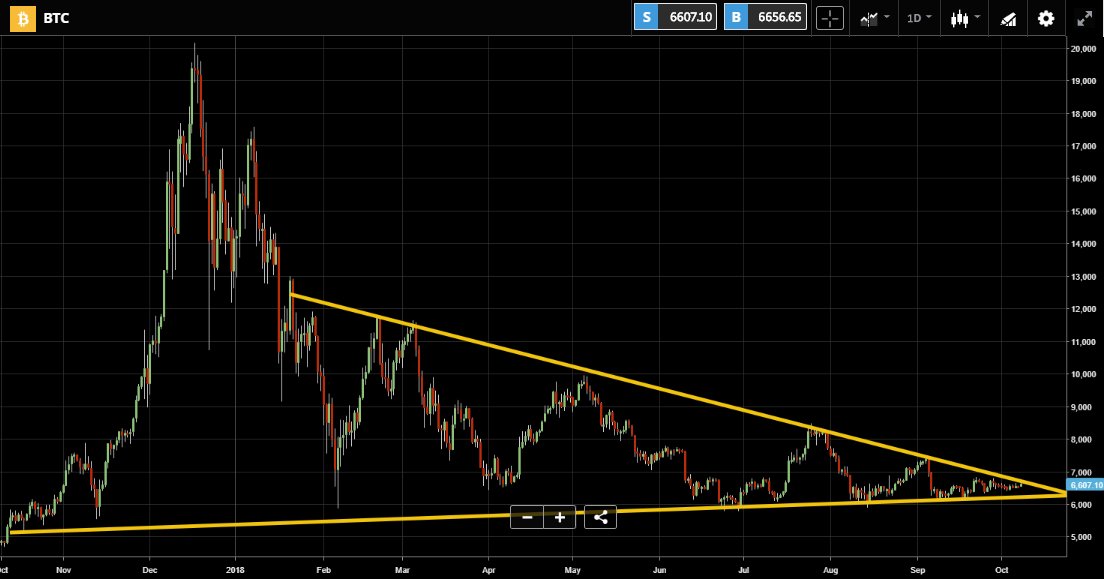
Bitcoin Price Update: Breakout Imminent as Price Looks to Move Beyond Descending Triangle
Bitcoin looks set for an imminent price breakout. The price action chart for the top-ranked cryptocurrency shows a classic breakout pattern which could potentially signal an end to the sideways trading of the last two months. дальше »
2018-10-8 19:45 | |
|
|
Bitcoin Price Watch: BTC/USD Holding Key Supports Above $6,350
Key Points Bitcoin price is trading above the $6,400 and $6,450 support levels against the US Dollar. There is a significant contracting triangle in place with support at $6,460 on the hourly chart of the BTC/USD pair (data feed from Kraken). дальше »
2018-10-8 12:28 | |
|
|
Cardano Price Analysis: ADA/USD Showing Positive Signs Above $0.080
Key Highlights ADA price is trading with a bullish angle above the $0. 0800 support against the US Dollar (tethered). There was a break above a major bearish trend line with resistance at $0. 0820 on the hourly chart of the ADA/USD pair (data feed via Bittrex). дальше »
2018-10-8 11:28 | |
|
|
Ripple Price Analysis: XRP/USD Under Pressure Below $0.5050
Key Highlights Ripple price declined heavily and broke the $0. 5200 and $0. 5050 support levels against the US dollar. This is a major bearish trend line in place with resistance at $0. 4950 on the hourly chart of the XRP/USD pair (data source from Kraken). дальше »
2018-10-8 10:30 | |
|
|
Ethereum Price Analysis: ETH/USD Remains Supported Above $220
Key Highlights ETH price is holding the $220 support level very well against the US Dollar. There is a short-term connecting bearish trend line formed with resistance at $225 on the hourly chart of ETH/USD (data feed via Kraken). дальше »
2018-10-8 09:28 | |
|
|
Bitcoin Cash Price Analysis: BCH/USD Eyeing Gains Above $525
Key Points Bitcoin cash price traded higher recently and moved above the $515 resistance against the US Dollar. There was a break above a crucial bearish trend line with resistance at $512 on the hourly chart of the BCH/USD pair (data feed from Kraken). дальше »
2018-10-8 07:28 | |
|
|
Ethereum (ETH): Final Shakeout Or Another Bear Trend?
Ethereum (ETH) seems to have just broken its symmetrical triangle to the downside. This was expected as the price entered the triangle from the upside. Symmetrical triangle being a continuation pattern had a higher chance of breaking to the downside. дальше »
2018-10-7 18:00 | |
|
|
Bitcoin Price Weekly Analysis: BTC/USD Buyers Losing Momentum Above $6,600
Key Points Bitcoin price formed a decent support near the $6,400 level against the US Dollar. There was a break above a major bearish trend line with resistance at $6,540 on the 4-hours chart of the BTC/USD pair (data feed from Kraken). дальше »
2018-10-7 09:28 | |
|
|
Ethereum Price Weekly Analysis: ETH/USD Remains in Broad Range
Key Highlights ETH price is currently trading in a broad range above the $210 support against the US Dollar. There is an ascending channel formed with support at $222 on the 4-hours chart of ETH/USD (data feed via Kraken). дальше »
2018-10-7 07:28 | |
|
|

XRP Price Looks Ready to Drop Another 20 Percent: Ripple Shorts Get Ready
For those that have been following the price articles that have been put out in recent times, the recent downturn in price is something that was anticipated a few days ago: https://www.tradingview.com/chart/XRPUSD/2nwG1KT3-XRP-Beginning-to-Look-Very-Bearish-in-the-Mid-Term/ Currently, the price of $XRP is down -10% for this period (on the daily), which is a pretty steep decline. So, what’s going […] дальше »
2018-10-7 23:30 | |
|
|
Cardano (ADA) Price Analysis: Trends of October 5–11, 2018
The price has formed a “symmetrical triangle” pattern on the 4-Hour chart. It is currently below the 4-day EMA which has crossed the 50-day EMA downward below the supply zone of $0. 08 inside the symmetrical triangle. дальше »
2018-10-6 17:43 | |
|
|
Ripple (XRP) Might Surprise The World In 2019
Chart for XRP/USD (1H) Ripple (XRP) is moving at a very fast pace. Anything is possible at this point. The Ripple team runs a very tight ship and they know how to get things done. The above chart for XRP/USD shows that Ripple (XRP) bulls have a tight grip on the price. дальше »
2018-10-5 17:30 | |
|
|
Ethereum (ETH) Bulls Are Losing The Game
Chart for ETH/USD (4H) Ethereum (ETH) has been trading in a strong ascending channel since the first signs of a trend reversal appeared. However, all hope of a recovery is once again lost as Ethereum (ETH) has just broken this channel. дальше »
2018-10-5 16:00 | |
|
|
Bitcoin Price Watch: Here is Why $6,600 is Significant for BTC
Key Points Bitcoin price remained below the $6,600 resistance level against the US Dollar. This week’s followed important bearish trend line is still active with resistance at $6,585 on the hourly chart of the BTC/USD pair (data feed from Kraken). дальше »
2018-10-5 11:28 | |
|
|
Ripple Price Analysis: XRP/USD Facing Hurdles Near $0.5450
Key Highlights Ripple price failed to break the $0. 5450 and $0. 5550 resistance levels against the US dollar. Yesterday’s highlighted key bearish trend line is intact with resistance at $0. 5465 on the hourly chart of the XRP/USD pair (data source from Kraken). дальше »
2018-10-5 10:28 | |
|
|
Ethereum Price Analysis: ETH/USD’s Support Turned Key Resistance
Key Highlights ETH price is facing a strong resistance near the previous support at $224-225 against the US Dollar. There is a declining channel in place with resistance at $223 on the hourly chart of ETH/USD (data feed via Kraken). дальше »
2018-10-5 09:28 | |
|
|
Bitcoin Cash Price Analysis: BCH/USD Remains at Risk of More Losses
Key Points Bitcoin cash price failed to move above the $530 resistance zone and declined against the US Dollar. This week’s followed important bearish trend line is intact with resistance at $525 on the hourly chart of the BCH/USD pair (data feed from Kraken). дальше »
2018-10-5 07:28 | |
|
|
Ripple (XRP) Might Decouple From Bitcoin (BTC)
Chart for XRP/USD (1D) Ripple (XRP) rally is far from over yet. Its independent price moves have sparked some heated debates in the past few weeks. A lot of Ripple (XRP) critics have called its recent price moves “organized pump and dump”. дальше »
2018-10-5 23:30 | |
|
|
Bitcoin Price Watch: Close Above $6,600 Could Lift Market Sentiment
Key Points Bitcoin price found support near $6,400 and bounced back against the US Dollar. Yesterday’s highlighted key bearish trend line is acting as a hurdle near $6,580-6,600 on the hourly chart of the BTC/USD pair (data feed from Kraken). дальше »
2018-10-4 12:28 | |
|
|
Ethereum Classic Price Analysis: ETC/USD Facing Significant Hurdle
Key Highlights Ethereum classic price is struggling to break the $11. 15-20 resistance area against the US dollar. There is a major bearish trend line in place with resistance at $11. 20 on the hourly chart of the ETC/USD pair (Data feed via Kraken). дальше »
2018-10-4 11:28 | |
|
|
Ripple Price Analysis: XRP/USD Approaching Key $0.5550 Resistance
Key Highlights Ripple price traded towards the $0. 5020 support during yesterday’s decline against the US dollar. There is a crucial bearish trend line formed with resistance at $0. 5550 on the hourly chart of the XRP/USD pair (data source from Kraken). дальше »
2018-10-4 10:28 | |
|
|
Ethereum Price Analysis: ETH/USD Recovering Towards $230
Key Highlights ETH price found support near the $213-214 zone after yesterday’s decline against the US Dollar. There was a break above a key bearish trend line with resistance at $221 on the hourly chart of ETH/USD (data feed via Kraken). дальше »
2018-10-4 10:00 | |
|
|
Bitcoin Cash Price Analysis: BCH/USD is Facing Uphill Task
Key Points Bitcoin cash price declined further and tested the $500 support against the US Dollar. There is a crucial bearish trend line in place with resistance at $530 on the hourly chart of the BCH/USD pair (data feed from Kraken). дальше »
2018-10-4 07:28 | |
|
|

Ripple (XRP): The Bulls Are Still In Charge
Ripple (XRP) has had its ups and downs. The price chose to make its own moves even as Bitcoin (BTC) remained undecided. We saw Ripple (XRP)’s rally come to a halt eventually. However, it does not mean that the bulls have lost the charge. дальше »
2018-10-4 00:00 | |
|
|
Are The Odds Against Bitcoin (BTC)?
Are the odds against Bitcoin (BTC)? In the short term, yes, the odds are against Bitcoin (BTC). The above daily chart for BTC/USD shows Bitcoin (BTC) trading in a symmetrical triangle. As can be seen very clearly, the price was falling before August 14 when it entered the symmetrical triangle. дальше »
2018-10-3 17:00 | |
|
|
Bitcoin Price Watch: BTC/USD Breakdown Below $6,520 Looks Real
Key Points Bitcoin price broke the $6,540 and $6,520 support levels to move into a bearish zone against the US Dollar. Yesterday’s highlighted important contracting triangle was breached with support at $6,520 on the hourly chart of the BTC/USD pair (data feed from Kraken). дальше »
2018-10-3 12:28 | |
|
|

Bitcoin Cash (BCH) Price Dominates: Latest News/Developments, Future Prediction
Mid-week and the crypto-verse market is taking a stride downside as prices are approaching supports just above important levels. Things are looking still pretty good on the weekly chart as Bitcoin [BTC], the largest by market capitalization, is still on the green with a few coins following. дальше »
2018-10-3 11:35 | |
|
|
Cardano Price Analysis: ADA/USD Likely To Extend Losses To $0.072
Key Highlights ADA price failed to hold the $0. 0820 support and declined recently against the US Dollar (tethered). There is a key bearish trend line in place with resistance at $0. 0830 on the hourly chart of the ADA/USD pair (data feed via Bittrex). дальше »
2018-10-3 11:28 | |
|
|
Ethereum Price Analysis: ETH/USD Breakdown Could Reach $203-207
Key Highlights ETH price failed to gain momentum above $232 and declined recently against the US Dollar. This week’s followed important bullish trend line was breached with support at $225 on the hourly chart of ETH/USD (data feed via Kraken). дальше »
2018-10-3 09:28 | |
|
|
Bitcoin Cash Price Analysis: BCH/USD Turns South Towards $500
Key Points Bitcoin cash price failed to break the $550 resistance and declined recently against the US Dollar. There was a break below a key bullish trend line with support at $525 on the hourly chart of the BCH/USD pair (data feed from Kraken). дальше »
2018-10-3 07:28 | |
|
|
Ethereum Price Analysis: Regulation is Important for Joseph Lubin, the CEO of ConsenSys
While ETH is up eight percent in the last week, volatility is low in lower time frames. ETH prices are stable in the daily chart but there is a strong ceiling at $250 popping bull attempts. As prices lack bullish support, the Austrian government is using Ethereum for auctioning their government bonds. дальше »
2018-10-3 05:00 | |
|
|
Litecoin (LTC) All Set To Finally Break Downtrend
Litecoin (LTC) has never been this bullish in a long time. The above weekly chart for LTC/USD shows how persistently it bottomed out between August and October. In addition to that, Litecoin (LTC) has now found a solid support right next to its downtrend resistance. дальше »
2018-10-2 17:00 | |
|
|
Ethereum Classic Price Analysis: ETC/USD Could Revisit $12
Key Highlights Ethereum classic price is consolidating above the $10. 80 support level against the US dollar. There is a key bearish trend line formed with resistance at $11. 35 on the hourly chart of the ETC/USD pair (Data feed via Kraken). дальше »
2018-10-2 11:30 | |
|
|
Ripple Price Analysis: XRP/USD Bullish Above $0.5520
Key Highlights Ripple price is holding the $0. 5500 and $0. 5520 support levels against the US dollar. There is a major breakout pattern formed with resistance at $0. 5820 on the hourly chart of the XRP/USD pair (data source from Kraken). дальше »
2018-10-2 10:30 | |
|
|
Ethereum Price Analysis: ETH/USD Eyeing Upside Break Above $236
Key Highlights ETH price remained in a tight range above the $222 and $223 support levels against the US Dollar. Yesterday’s highlighted key bullish trend line is intact with support at $224 on the hourly chart of ETH/USD (data feed via Kraken). дальше »
2018-10-2 09:28 | |
|
|
Bitcoin Cash Price Analysis: BCH/USD Gaining Momentum Towards $570
Key Points Bitcoin cash price found support above the $500 level and started an upward move against the US Dollar. Yesterday’s highlighted connecting bearish trend line with resistance at $535 was breached on the hourly chart of the BCH/USD pair (data feed from Kraken). дальше »
2018-10-2 07:28 | |
|
|
Stellar Lumens (XLM) Price Watch: Ascending Triangle Formation
Stellar Lumens Price Key Highlights Stellar Lumens has formed higher lows and found resistance around 0. 2600 to create an ascending triangle on its 1-hour chart. Price is nearing the peak of its formation so a breakout in either direction could take place really soon. дальше »
2018-10-2 07:24 | |
|
|
Ethereum (ETH) Price Analysis: Waiting for a Consolidation Break
Ethereum has formed lower highs and higher lows to create a symmetrical triangle on its 1-hour chart. The post Ethereum (ETH) Price Analysis: Waiting for a Consolidation Break appeared first on Ethereum World News. дальше »
2018-10-2 04:41 | |
|
|

Bitcoin Price Analysis: BTC Ready to Explode In Q4
As Bitcoin closed for the third quarter of 2018, we take a look at the big picture and see what’s in store for the final quarter of 2018. Monthly Chart September marked Bitcoin’s tightest relative trading range since 2016 — opening the month of September at $7,015 and closing the month, the week, and the quarter at $6,598. дальше »
2018-10-2 02:00 | |
|
|
Ripple (XRP) Risks Significant Selloff Short Term
Ripple (XRP) has defied Bitcoin (BTC)’s gravitational pull these past few weeks. The above 1H chart for XRP/USD shows that Ripple (XRP) has surged aggressively these past few days. There have been no signs of a slowdown. дальше »
2018-10-2 00:30 | |
|
|
EOS/USD Price Analysis: Trends of October 1–7, 2018
The price has formed an “ascending triangle” pattern on the daily and 4-hour chart which suggests the probability for the price increase toward a resistance level of $6.8. The post EOS/USD Price Analysis: Trends of October 1–7, 2018 appeared first on CoinSpeaker. дальше »
2018-10-2 00:15 | |
|
|
Analyst: Logarithmic Chart Shows Bitcoin is on Track, $50,000 by 2021
Prominent Bitcoin and cryptocurrency analyst Willy Woo recently shared a logarithmic price chart of Bitcoin created by technical analyst known as Awe and Wonder that suggests the dominant cryptocurrency is on track towards gradual recovery. дальше »
2018-10-1 23:00 | |
|
|
Bitcoin (BTC)’s Breakout And Rise To New ATH Is Inevitable
Bitcoin (BTC)’s breakout from this point forward is inevitable. The price has been consolidating in a bullish pennant since last month. No investor or analyst who draws bullish pennants like these on a chart presents a bearish case. дальше »
2018-10-1 17:00 | |
|
|
Bitcoin Price Analysis - Large move soon
Volatility continues to grind lower as we approach Q4. The leading bias of any upcoming move, as well as a bullish and bearish roadmap, can be determined using Bollinger Bands, Pitchforks, exponential moving averages, Wyckoff Method, chart patterns, and the Ichimoku Cloud. дальше »
2018-10-5 14:01 | |
|
|