Новости о Pattern Daily [ Фото новости ] [ Свежие новости ] | |

EOS / USD Price Analysis: Pressured
EOS is bullish in the short-term, with the cryptocurrency still holding price above major technical support The EOS / USD pair continues to trade above its 200-day moving average The daily time shows that a bullish inverted head and shoulders pattern has formed EOS / USD Short-term price analysis EOS has a bullish short-term trading […] The post EOS / USD Price Analysis: Pressured appeared first on Crypto Briefing. дальше »
2019-4-23 18:01 | |
|
|
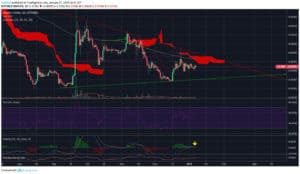
LTC / USD Price Analysis: Continuing Descent
Litecoin is neutral in the short-term, with the cryptocurrency testing back towards its 200-period moving average The LTC / USD pair retains its bullish medium-term outlook, with price holding firm above its 200-day moving average A large inverted head and shoulders pattern still remains valid on the daily time frame LTC / USD Short-term price […] The post LTC / USD Price Analysis: Continuing Descent appeared first on Crypto Briefing. дальше »
2019-4-23 17:33 | |
|
|
VET / USD Price Analysis: Consolidation Period
VeChain has a bullish short-term bias, with the cryptocurrency continuing to trade above major technical support The four-hour time frame shows a bullish descending triangle breakout in progress The inverted head and shoulders pattern on the daily time frame has now reached its upside target VeChain / USD Short-term price analysis VeChain has a bullish […] The post VET / USD Price Analysis: Consolidation Period appeared first on Crypto Briefing. дальше »
2019-4-20 18:09 | |
|
|
ADA / USD Price Analysis: Corrective Pullback
Cardano has a bullish short-term bias, with the cryptocurrency still trading well above its 200-period moving average The daily time frame chart is showing a large inverted head and shoulders pattern Bullish MACD price divergence remains present on the daily time frame chart from May last year Cardano / USD Short-term price analysis Cardano maintains […] The post ADA / USD Price Analysis: Corrective Pullback appeared first on Crypto Briefing. дальше »
2019-4-20 17:13 | |
|
|
XRP / USD Price Analysis: Last Chance
Ripple has a bullish short-term trading bias, with the cryptocurrency making a strong recovery above its 200-period moving average The XRP / USD pair retains a neutral trading bias over the medium-term The daily time frame shows that bulls are attempting to close price above the ascending triangle pattern Ripple / USD Short-term price analysis […] The post XRP / USD Price Analysis: Last Chance appeared first on Crypto Briefing. дальше »
2019-4-19 18:10 | |
|
|
Holochain / USD Price Analysis: Probing New Heights
HOT (Holochain) has a bullish short-term outlook, with the cryptocurrency probing towards its current 2019 trading high Bulls are trying to invalidate a bearish head and shoulders pattern on the four-hour time frame The daily time frame shows that the HOT / USD pair is attempting a major technical breakout Holochain / USD Short-term price […] The post Holochain / USD Price Analysis: Probing New Heights appeared first on Crypto Briefing. дальше »
2019-4-19 17:55 | |
|
|
Bitcoin / USD Technical Analysis: Critical Round
Bitcoin has a bullish short-term outlook, with the BTC / USD pair regaining bullish momentum above the $5,100 level The four-hour time frame shows a bearish head and shoulders pattern The Ichimoku indicator on daily time frame is showing that the $5,200 level is an important pivot Bitcoin / USD Short-term price analysis Bitcoin has […] The post Bitcoin / USD Technical Analysis: Critical Round appeared first on Crypto Briefing. дальше »
2019-4-18 17:12 | |
|
|
Monero / USD Technical Analysis: Catching The Uptrend
Monero is bullish in the short-term, with the XMR / USD pair advancing higher after a brief technical correction The four-hour time frame shows the formation of a bullish descending wedge pattern The daily time frame shows that the bullish inverted head and shoulders pattern has yet to reach its upside target Monero / USD […] The post Monero / USD Technical Analysis: Catching The Uptrend appeared first on Crypto Briefing. дальше »
2019-4-18 16:42 | |
|
|
Tezos / USD Technical Analysis: Second Stage Firing
Tezos remains bullish in the short-term, with the XTZ / USD pair breaking above a triangle pattern on the four-hour time frame The daily time frame also shows that a bullish breakout from a triangle is underway The large inverted head and shoulders pattern on the daily time frame has reached its overall upside objective […] The post Tezos / USD Technical Analysis: Second Stage Firing appeared first on Crypto Briefing. дальше »
2019-4-16 18:13 | |
|
|
TRON Price Prediction Today: Daily (TRX) Value Forecast – April 8
The short and medium-term outlook is in the uptrend. Buying at pullback areas may be considered with reversal candlesticks pattern as confirmation. TRX/USD Medium-term Trend: Bullish Supply zones: $0. дальше »
2019-4-8 14:01 | |
|
|
TRON Price Prediction Today: Daily (TRX) Value Forecast – April 4
The bears are in control of both the short and medium-term outlook. Traders may look to sell at pullback areas with bearish reversal candlestick pattern as confirmation. TRX/USD Medium-term Trend: Bearish Supply zones: $0. дальше »
2019-4-4 20:21 | |
|
|

Bitcoin Price Analysis: Buckle Up, $5K is Open Range
An impressive move higher for Bitcoin and cryptocurrencies yesterday took bitcoin price across the $5k handle for the first time in 2019. Let’s take a look at the market to try to determine if we can expect more upside to come. дальше »
2019-4-3 17:00 | |
|
|
Bitcoin (BTC) Price Analysis: Bears Defend Resistance Again
Bitcoin has formed lower highs and higher lows to trade inside a symmetrical triangle pattern on the daily time frame. Price has once again been rejected at the triangle resistance, so it might be setting. дальше »
2019-3-12 06:44 | |
|
|

Bitcoin Price Analysis: New High Paves Potential Reversal Setup
After days and days of consolidation, bitcoin finally managed to break a new high for the first time in almost two weeks. This new high, so far, has been short lived, however, as it was almost immediately sold into by eager bears:Figure 1: BTC-USD, 4-Hour Candles, New HighOur current 4-hour candle is seeing a relatively easy retracement after days and days of an upward grind. дальше »
2019-3-9 02:08 | |
|
|
Bitcoin Price Analysis: Bullish Setups Could Break Current Market Structure
The cryptomarket remains coiled as we lead into the weekend with no new highs and no new lows being established for bitcoin. However, it is nicely consolidating on lower time frames and hints toward the possibility of another leg up:Figure 1: BTC-USD, Hourly Candles, Consolidating PennantThe pattern shown in Figure 1 outlines a potential continuation pattern called a “bullish pennant. дальше »
2019-2-23 02:23 | |
|
|
Bitcoin Price Analysis: Consolidation Breaks Out Into Macro Resistance Test
Over the course of the last 10 days, bitcoin has managed to rally nearly 20% in value as it burst through two major resistance levels and is now beginning the test of a major macro level:Figure 1: BTC-USD, Daily Candles, Macro ResistanceWe can see a clear, descending supply-and-demand channel that governed the market for the last two months. дальше »
2019-2-20 01:38 | |
|
|
Ethereum (ETH) Daily Price Forecast – February 6
ETH/USD Medium-term Trend: Bearish Resistance Levels: $240, $250, $260 Support Levels: $100, $90, $80 Yesterday, February 5, the price of Ethereum was in a bearish trend zone. Since on February 3, the 12-day EMA and the 26-day EMA were in a horizontal pattern indicating that price was in a sideways trend. Yesterday as the crypto's […] дальше »
2019-2-6 09:51 | |
|
|
Ripple’s XRP: Price Progressively More Bearish as Week Wraps Up
XRP’s price has been becoming increasingly bearish as the week progresses. Last week, the price of XRP broke bearishly out of a descending triangle which is a typical trend continuation pattern. дальше »
2019-1-18 18:44 | |
|
|
CARDANO (ADA) Daily Price Forecast –January 16
ADA/USD Medium-term Trend: Bullish Supply zones: $0. 0600, $0. 06600, $0. 06800 Demand zones: $0. 02000, $0. 01500, $0. 01000 ADA returns to a bullish trend in its medium-term outlook. The cryptocurrency shows an inverted head and shoulder pattern. дальше »
2019-1-16 15:57 | |
|
|
Tron (TRX) Daily Price Forecast – January 14
TRX/USD Medium-term Trend: Bullish Supply zones: $0. 04000, $0. 05000, $0. 06000 Demand zones: $0. 01000, $0. 00900, $0. 00800 TRX returns to a bullish trend in its medium-term outlook. An inverted head and shoulder pattern is the cryptocurrency structure in the medium-term. дальше »
2019-1-14 17:05 | |
|
|
Price Analysis: Bitcoin, Ethereum, XRP, Stellar, Litecoin, Cardano, EOS, IOTA, Tron, and Dogecoin
Bitcoin [BTC] Price Analysis: A look at the Daily chart for Bitcoin shows that price is currently trading at the $4100 level. Price is trying to make a reverse head and shoulders pattern with a neckline at $4440, coinciding with the 0. дальше »
2019-1-8 21:39 | |
|
|
Bitcoin Price Analysis: Range-Bound Market Coiled for Next Move
For the better part of a month and a half, bitcoin has been fairly range-bound and unable to establish new lows or new highs. There are some bullish and bearish setups on the horizon for bitcoin, so let’s check out both sides of the argument because currently the market is sitting in the middle of Indecisionville — the most immediate sign of which is this glaringly obvious head-and-shoulders bottom reversal pattern:Figure 1: BTC-USD, Daily Candles, Head-and-Shoulders BottomThis current pattern is nothing more than a setup at the moment, but it represents one potential outcome of this sustained consolidation. дальше »
2019-1-4 02:22 | |
|
|
Does an Ascending Triangle for Bitcoin [BTC] Mean Price is Finished Bottoming Out?
Cryptocurrencies have had a bullish start to 2019 after an extremely bearish finish to 2019. The market leader is Bitcoin is forming an ascending triangle pattern on the daily. An ascending triangle is a bullish continuation pattern which is formed by both an upward trend line and a point of resistance. дальше »
2019-1-3 17:47 | |
|
|

Bitcoin Price Analysis: Strong Rally Tests Overhanging Resistance
Earlier this week, bitcoin enjoyed a strong and quick rally, spanning all the way from the low $3,100s to the upper $3,900s — in other words, a move that previously took the market weeks to make, this time took place in just a few short days. дальше »
2018-12-20 02:21 | |
|
|
Bitcoin Price Analysis: Bear Pennant Breakout Puts $1,700 Price in Sight
Another week, another low. Bitcoin’s market has been bleeding relentlessly for weeks and now, after falling 50% in value in just one month, the market has managed to break south of a major bearish consolidation pattern called a bear pennant:Figure 1: BTC-USD, 4-Hour Candles, Bear Pennant BreakoutThis is a massive bear pennant with a staggering $2,000 measured move. дальше »
2018-12-12 01:52 | |
|
|
STELLAR (XLM) Daily Price Forecast – December 11
XLM/USD Medium-term Trend: Bearish Supply zone: $0. 2000, $0. 2500, $0. 3000 Demand zone: $0. 0800, $0. 0600, $0. 0400 XLM continues in a bearish trend as it breaks down from the bearish pennant pattern in its medium-term outlook. дальше »
2018-12-11 07:55 | |
|
|
Bitcoin (BTC) Price Analysis: Wedge Support Test
Bitcoin broke below a short-term consolidation pattern and is making its way down to test the bottom of the falling wedge on its daily time frame. Another break lower could expose this cryptocurrency to a steep free fall. дальше »
2018-11-23 04:32 | |
|
|
Litecoin (LTC) Daily Price Forecast – November 22
LTC/USD Medium-term Trend: Ranging Resistance Levels: $66, $68, $70 Support Levels: $30, $28, $26 Yesterday, November 21, the price of Litecoin was in a sideways trend. The digital currency fell to the low of $33. дальше »
2018-11-22 09:25 | |
|
|
Litecoin (LTC) Daily Price Forecast – November 21
LTC/USD Medium-term Trend: Bearish Resistance Levels: $66, $68, $70 Support Levels: $30, $28, $26 Yesterday, November 20, the price of Litecoin was in a bearish trend. The crypto's price no longer follow the bearish pattern of lower lows and lower highs. дальше »
2018-11-21 09:49 | |
|
|
Bitcoin Price Analysis: Yearly Support Breaks as Bitcoin Tests Underlying Demand
After months and months of consolidation, the yearly support finally broke and now bitcoin has found itself in the lower $5000s for the first time since 2017:Figure 1: BTC-USD, Daily Candles, Broken SupportBitcoin managed to drop a staggering 16% yesterday as the market sliced through the long held support like a knife through butter. дальше »
2018-11-16 01:28 | |
|
|
Bitcoin Cash (BCH) Daily Price Forecast – November 1
BCH/USD Medium-term Trend: Bearish Supply zones: $600, $700, $800 Demand zones: $300, $200, $100 BCH is back in a bearish trend in its medium-term outlook. After a remarkable move to the upside as predicted yesterday the cryptocurrency resume the journey south. дальше »
2018-11-1 08:38 | |
|
|

Prominent Analyst: Bitcoin is Still in the Middle of a Bear Market
An inverse monetary velocity pattern indicates that bitcoin bulls are wrong about the market’s next bull run. Willi Woo, a prominent cryptocurrency market analyst, pitted the digital currency network value (or market cap) against the daily US Dollar volume transmitted through the blockchain. дальше »
2018-10-27 14:34 | |
|
|
Bitcoin Price Analysis: Bitcoin Consolidation Forecasts $3,500 Move
A strong round of buys hit the market this weekend as unsubstantiated rumors began to circle surrounding Tether and Bitfinex’s potential insolvency. I won’t be going into the details surrounding the allegations because, like I said, they are nothing more than unsubstantiated rumors. дальше »
2018-10-17 01:03 | |
|
|
Bitcoin (BTC) Price Analysis: Still Buying on Dips?
Bitcoin has formed lower highs and higher lows on its daily time frame to create a symmetrical triangle consolidation pattern. Price has dropped back down to support, which appears to be defended by bulls buying on dips. дальше »
2018-10-15 07:05 | |
|
|
Bitcoin (BTC): A Method To The Madness
Bitcoin (BTC) does not just go up and down, breaks supports and resistances based on sudden whims. Most traders are so focused on the 15 min chart that they miss the big picture. They fail to realize that major trading on exchanges is done by algorithmic bots. дальше »
2018-10-15 21:30 | |
|
|
Ethereum Classic (ETC) Can Easily End The Year Above $100
Ethereum Classic (ETC) is highly likely to trade north of $100 by end of the year. This does not require a very bullish Bitcoin (BTC). In fact, if Bitcoin (BTC) trades around $10,000, that would do the job for Ethereum Classic (ETC). дальше »
2018-10-12 17:30 | |
|
|
Ethereum (ETH) Price Watch: Next Downside Targets
Ethereum Price Key Highlights Ethereum broke below its latest consolidation pattern, indicating that losses are in the cards. Price is still trading inside a descending channel on the daily chart and looks ready for a test of support. дальше »
2018-10-12 06:47 | |
|
|
Are Bitcoin Whales The Ones Shaping The Market?
A popular school of thought among many people in the crypto space is that a small number of Bitcoin owners with a big enough load of bitcoin to move the market are behind the unstable markets and the price manipulation. дальше »
2018-10-11 16:30 | |
|
|
Eos (EOS) Investors Unmoved By Bitcoin (BTC) Selloff
Chart for EOS/USD (1W) Cryptocurrency markets plunge deep in the red, dancing to the tune of Bitcoin (BTC). Eos (EOS) investors are not moved by this confusion. In fact, as the above weekly chart for EOS/USD shows, the price of Eos (EOS) has not corrected the same way as the rest of the market. дальше »
2018-10-11 00:30 | |
|
|
Ethereum (ETH) Daily Price Forecast – October 8
ETH/USD Medium-term Trend: Bullish Resistance Levels: $260, $280, $300 Support Levels: $200, $180, $160 Last week the price of Ethereum was in a sideways trend. There has been no significant price movement as the digital currency moves in a horizontal pattern. дальше »
2018-10-8 15:59 | |
|
|
Ethereum (ETH): Final Shakeout Or Another Bear Trend?
Ethereum (ETH) seems to have just broken its symmetrical triangle to the downside. This was expected as the price entered the triangle from the upside. Symmetrical triangle being a continuation pattern had a higher chance of breaking to the downside. дальше »
2018-10-7 18:00 | |
|
|
Tron (TRX) Price Analysis: Trends of October 2–8, 2018
There is a probability for the uptrend movement this week in case the price breakout to the north from the ascending triangle pattern formed on both daily and 4-Hour charts. The post Tron (TRX) Price Analysis: Trends of October 2–8, 2018 appeared first on CoinSpeaker. дальше »
2018-10-3 11:30 | |
|
|
EOS/USD Price Analysis: Trends of October 1–7, 2018
The price has formed an “ascending triangle” pattern on the daily and 4-hour chart which suggests the probability for the price increase toward a resistance level of $6.8. The post EOS/USD Price Analysis: Trends of October 1–7, 2018 appeared first on CoinSpeaker. дальше »
2018-10-2 00:15 | |
|
|
Bitcoin (BTC) Compound Fulcrum And Correlation With Copper
Bitcoin (BTC) is printing a pattern which is a very rare sight in the world of technical analysis. This formation seen on the above daily chart for BTC/USD is called a compound fulcrum. It comprises of an inverse head and shoulders and a head and shoulders trading inside a wedge in the order visible above. дальше »
2018-9-28 17:00 | |
|
|
EOS/USD Price Analysis: Trends of September 24–30, 2018
The price has formed a “pennant” pattern on the daily chart which suggests the probability for the price to fall toward support level of $4.1. The post EOS/USD Price Analysis: Trends of September 24–30, 2018 appeared first on CoinSpeaker. дальше »
2018-9-24 19:18 | |
|
|
Ethereum (ETH) One Step Away From Kicking Off The Altcoin Rally
It is a rare sight in the crypto community to see Ethereum (ETH) in the green after a long queue of weeks in the red. The daily chart above for ETH/USD shows that Ethereum (ETH) is just a single step away from kicking off the altcoin rally. дальше »
2018-9-13 18:30 | |
|
|

Bitcoin Price Analysis: Just Another Pump-Fake or Will BTC Breakout?
Bears remain fully in control of Bitcoin price, yet somehow, the $6,000 support is holding…for now. Bitcoin Price: 4-Hour Chart After posting a daily high at $6,460, bitcoin price fell below the wedge formation and constant rejections at the 20-MA have kept BTC in the pattern of lower lows. дальше »
2018-9-12 13:00 | |
|
|
Bitcoin Price Analysis: How Long Will $6000 Support Hold?
Bears remain fully in control of Bitcoin price, yet somehow, the $6,000 support is holding…for now. Bitcoin Price: 4-Hour Chart After posting a daily high at $6,460, bitcoin price fell below the wedge formation and constant rejections at the 20-MA have kept BTC in the pattern of lower highs. дальше »
2018-9-12 13:00 | |
|
|