Новости о Pattern Could [ Фото новости ] [ Свежие новости ] | |

Cardano (ADA) Price Analysis: Major Reversal Pattern Formed
Cardano could be due for a huge reversal from its previous long-term slide as an inverse head and shoulders pattern has formed on its 4-hour time frame. Price has yet to break past the neckline resistance at the 0. дальше »
2019-1-8 07:27 | |
|
|
Litecoin [LTC] Leads the Crypto Market As Its Price Bullishly Breaks Through Resistance
There have been occasions in the past where Litecoin has led the rest of the cryptocurrency market. This could be the case currently with Litecoin leading the market despite other major cryptocurrencies not following suit. дальше »
2019-1-6 18:19 | |
|
|
Bitcoin (BTC) Price Analysis: Back to Support, Bulls Overpowered?
Bitcoin is still stuck in its symmetrical triangle consolidation pattern after getting rejected on the test of resistance. Price is nearing the bottom of the triangle around the $3,900 mark and a break lower could signal that bears have gotten the upper hand. дальше »
2019-1-4 05:39 | |
|
|

Bitcoin Price Analysis: Range-Bound Market Coiled for Next Move
For the better part of a month and a half, bitcoin has been fairly range-bound and unable to establish new lows or new highs. There are some bullish and bearish setups on the horizon for bitcoin, so let’s check out both sides of the argument because currently the market is sitting in the middle of Indecisionville — the most immediate sign of which is this glaringly obvious head-and-shoulders bottom reversal pattern:Figure 1: BTC-USD, Daily Candles, Head-and-Shoulders BottomThis current pattern is nothing more than a setup at the moment, but it represents one potential outcome of this sustained consolidation. дальше »
2019-1-4 02:22 | |
|
|
Bitcoin (BTC) Price Analysis: Larger Reversal Pattern Forming
Bitcoin might be ready for a longer-term climb as it forms an inverse head and shoulders pattern on its 4-hour time frame. Price has yet to test and break past the resistance but if it does, bitcoin could be in for a climb that’s the same height as the chart formation. дальше »
2019-1-2 05:10 | |
|
|
Litecoin (LTC) Price Analysis: Primed For More Gains
Litecoin price traded as high as $33. 53 recently and later corrected lower. LTC remains supported on dips and it could bounce back above $33. 00 and $35. 00. Key Talking Points Litecoin price struggled to break the $33. дальше »
2018-12-31 08:08 | |
|
|
Ripple (XRP) Price Analysis: Currency Could Be Breaking Out Anytime Soon
XRP/USD Medium-term Trend: Ranging Resistance Levels: $0. 38, $0. 43, $ 0. 46 Support Levels: $0. 33, $0. 28, $0. 22 XRP is on the ranging trend on the medium-term outlook. The bullish momentum placed the coin on the high of $0. дальше »
2018-12-27 19:29 | |
|
|

Bitcoin Price Analysis: Strong Rally Tests Overhanging Resistance
Earlier this week, bitcoin enjoyed a strong and quick rally, spanning all the way from the low $3,100s to the upper $3,900s — in other words, a move that previously took the market weeks to make, this time took place in just a few short days. дальше »
2018-12-20 02:21 | |
|
|
Ripple (XRP) Price Analysis: Upside Momentum Gaining Traction
Ripple recently broke above a descending trend line hinting that a reversal from the slide may be in order. Price has since gained momentum on this upside move as it also busted through a consolidation pattern. дальше »
2018-12-18 05:22 | |
|
|
Ethereum (ETH) Price Analysis: Downside Triangle Breakout
Ethereum was previously consolidating inside a symmetrical triangle pattern and has broken below support to signal that further declines are in the works. Price could be due for a quick pullback to support before heading further south. дальше »
2018-12-14 06:50 | |
|
|
Bitcoin Price Analysis: Bear Pennant Breakout Puts $1,700 Price in Sight
Another week, another low. Bitcoin’s market has been bleeding relentlessly for weeks and now, after falling 50% in value in just one month, the market has managed to break south of a major bearish consolidation pattern called a bear pennant:Figure 1: BTC-USD, 4-Hour Candles, Bear Pennant BreakoutThis is a massive bear pennant with a staggering $2,000 measured move. дальше »
2018-12-12 01:52 | |
|
|
Cardano Price Analysis: ADA/USD Remains Supported Above $0.035
Key Highlights ADA price topped near the $0. 0440 level and later corrected lower against the US Dollar (tethered). There is a major breakout pattern in place with resistance at $0. 0430 on the hourly chart of the ADA/USD pair (data feed via Bittrex). дальше »
2018-12-3 11:28 | |
|
|
Bitcoin (BTC) Price Analysis: Wedge Support Test
Bitcoin broke below a short-term consolidation pattern and is making its way down to test the bottom of the falling wedge on its daily time frame. Another break lower could expose this cryptocurrency to a steep free fall. дальше »
2018-11-23 04:32 | |
|
|
Ripple (XRP) Price Analysis: Triangle Breakdown Looming?
Ripple has been one of the better-performing altcoins but it looks like the bearish pressure is also starting to creep in. Price has been consolidating inside a symmetrical triangle pattern and is now testing support at the . дальше »
2018-11-21 04:30 | |
|
|
Bitcoin Price Weekly Analysis: Sell Rallies In BTC/USD Near $5,880
Key Points Bitcoin price declined heavily and traded close to the $5,200 support level against the US Dollar. There is a short term consolidation pattern formed with resistance at $5,550 on the 4-hours chart of the BTC/USD pair (data feed from Kraken). дальше »
2018-11-18 09:30 | |
|
|
Bitcoin Price Pattern Suggests a Bounce May Be Coming
If past events are a guide, bitcoin could in for a recovery rally, following the formation of a "long-legged doji" on the charts Thursday. дальше »
2018-11-16 14:30 | |
|
|
Litecoin Price Analysis: LTC/USD Remains Sell Near $45
Litecoin price declined further below the $40. 00 level against the US Dollar. LTC/USD is currently correcting higher, but it could face sellers near $45. 00. Key Talking Points Litecoin price extended declines and spiked below the $40. дальше »
2018-11-16 07:50 | |
|
|
Ethereum Classic Price Analysis: ETC/USD Tumbles To New 2018 Low
Key Highlights Ethereum classic price declined sharply and broke the $8. 00 and $7. 00 supports against the US dollar. There is a short term consolidation pattern forming with resistance at $7. 70 on the hourly chart of the ETC/USD pair (Data feed via Kraken). дальше »
2018-11-15 09:28 | |
|
|
Bitcoin (BTC) Price Analysis: Strong Downside Break, How Low Can It Go?
Bitcoin had formed lower highs and higher lows to consolidate inside a symmetrical triangle on its 4-hour time frame before breaking to the downside. This signals that bears have won over and that further declines are underway. дальше »
2018-11-15 06:24 | |
|
|
Bitcoin Cash Price Analysis: With or Without Consensus, BCH/USD Could Test $850
A week to Bitcoin Cash’s half-year software upgrade and BCH/USD is vibrant, adding 45 percent in the last week. Aside from that, BCH is trading above $600 in a bull break out pattern meeting our previous BCH/USD trade plans. дальше »
2018-11-8 05:15 | |
|
|
Ripple (XRP) Price Watch: Inverted Head and Shoulders
Ripple Price Key Highlights Ripple might be done with its slide as it forms an inverted head and shoulders reversal pattern on its 4-hour chart. A break above the neckline could confirm that an uptrend of the same height as the chart formation might be in the works. дальше »
2018-10-25 10:00 | |
|
|
Stellar (XLM) Price Analysis: Is That a Reversal Pattern?
Stellar could be in for a rally as it formed an inverted head and shoulders pattern on its 1-hour chart. Price is currently testing the neckline and a break higher could send it up by roughly the same height as the chart formation, which spans 0. дальше »
2018-10-23 06:14 | |
|
|
Ripple Price Analysis: XRP/USD Could Correct Lower To $0.4350
Key Highlights Ripple price failed to stay above the $0. 4600 support and declined recently against the US dollar. There was a break below an ascending triangle pattern with support at $0. 4630 on the hourly chart of the XRP/USD pair (data source from Kraken). дальше »
2018-10-19 10:30 | |
|
|
Bitcoin (BTC) Price Analysis: Still Buying on Dips?
Bitcoin has formed lower highs and higher lows on its daily time frame to create a symmetrical triangle consolidation pattern. Price has dropped back down to support, which appears to be defended by bulls buying on dips. дальше »
2018-10-15 07:05 | |
|
|
Litecoin Price Analysis: Gemini Announce Litecoin Support, Boost Bulls
Despite Gemini support and yesterday’s two percent gain, sellers are in control. In fact, we may see prices sliding below $50 confirming the trend resumption phase of the bear break out pattern that begun in early August. дальше »
2018-10-13 05:00 | |
|
|
Ethereum Classic (ETC) Can Easily End The Year Above $100
Ethereum Classic (ETC) is highly likely to trade north of $100 by end of the year. This does not require a very bullish Bitcoin (BTC). In fact, if Bitcoin (BTC) trades around $10,000, that would do the job for Ethereum Classic (ETC). дальше »
2018-10-12 17:30 | |
|
|
Ethereum (ETH) Price Watch: Next Downside Targets
Ethereum Price Key Highlights Ethereum broke below its latest consolidation pattern, indicating that losses are in the cards. Price is still trading inside a descending channel on the daily chart and looks ready for a test of support. дальше »
2018-10-12 06:47 | |
|
|
Eos (EOS) Investors Unmoved By Bitcoin (BTC) Selloff
Chart for EOS/USD (1W) Cryptocurrency markets plunge deep in the red, dancing to the tune of Bitcoin (BTC). Eos (EOS) investors are not moved by this confusion. In fact, as the above weekly chart for EOS/USD shows, the price of Eos (EOS) has not corrected the same way as the rest of the market. дальше »
2018-10-11 00:30 | |
|
|
Bitcoin (BTC) Price Analysis: Slow and Steady Does It!
Bitcoin recently broke out of its long-term symmetrical triangle pattern, indicating that a rally is in the works. Zooming in to short-term charts shows that price is also inside an ascending channel and is currently testing the mid-channel area of interest. дальше »
2018-10-9 05:59 | |
|
|
Bitcoin Price Update: Breakout Imminent as Price Looks to Move Beyond Descending Triangle
Bitcoin looks set for an imminent price breakout. The price action chart for the top-ranked cryptocurrency shows a classic breakout pattern which could potentially signal an end to the sideways trading of the last two months. дальше »
2018-10-8 19:45 | |
|
|
Traders Remain Unsure of Bitcoin Direction As Volatility Hits 2018 Low
Bitcoin continues to consolidate as October progresses. Price action is trading around the end of the triangle pattern which has been forming since January. In previous articles, we outlined three potential scenarios which could play out. дальше »
2018-10-8 17:29 | |
|
|
Bitcoin (BTC) Price Watch: Is That a Bullish Breakout Yet?
Bitcoin Price Key Highlights Bitcoin price appears to be closing above the top of its symmetrical triangle pattern to show that bulls are gaining the upper hand. If so, this could lead to a rally that’s roughly the same height as the formation, which spans $6,000 to $10,000. дальше »
2018-10-8 06:41 | |
|
|

Mike Novogratz Pours Water on Bullish Crypto Forecasts, Says Bitcoin Won’t Cross $9,000 by Year-End
The crypto market has mainly declined in price this year, however, just recently it has been consolidating sideways. The bulls are still holding on to their beliefs tightly, hoping for a pattern reversal that could imitate last year’s all-time high run. дальше »
2018-10-5 14:59 | |
|
|
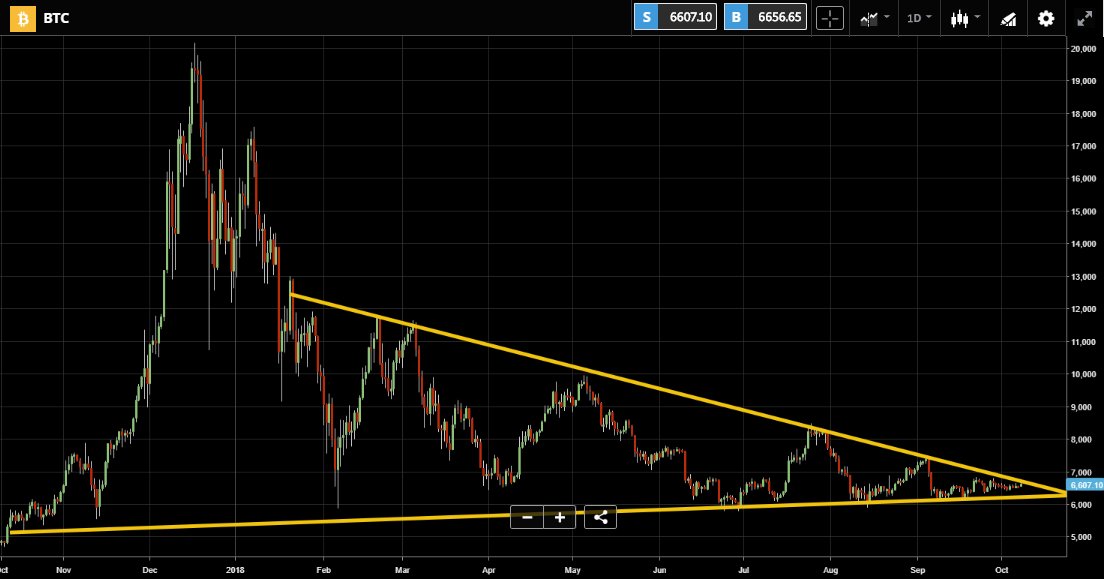
Bitcoin (BTC) Price Watch: Ready for a Long-Term Breakout?
Bitcoin Price Key Highlights Bitcoin is now at the very end of its long-term triangle consolidation pattern, so a breakout could happen anytime soon. Price is currently testing the resistance around $6,600 and a long green candle closing above this could be enough to signal further gains. дальше »
2018-10-4 07:05 | |
|
|
Bitcoin (BTC) Price Watch: Line in the Sand for Buyers?
Bitcoin Price Key Highlights Bitcoin price is back down to the bottom of its short-term ascending channel. This coincides with the support of a long-term triangle consolidation pattern, so there may be plenty of buy orders here. дальше »
2018-10-3 07:32 | |
|
|
Bitcoin (BTC) Price Watch: Still Stuck in Consolidation, Breakout Soon?
Bitcoin Price Key Highlights Bitcoin price is still stuck inside its triangle consolidation pattern on the 1-hour time frame. Price is nearing the peak of its formation so a breakout could take place soon. дальше »
2018-10-2 07:12 | |
|
|
Bitcoin Bullish With a Higher Low in Price Formed
The descending triangle pattern remains the dominant discussion point among traders in Bitcoin. It is an important pattern and could be the key to whether this bear market continues for a prolonged period of time or whether a sharp break up occurs. дальше »
2018-9-27 17:56 | |
|
|
Bitcoin (BTC) Price Watch: Will a Triangle Breakout Happen Soon?
Bitcoin Price Key Highlights Bitcoin price is still consolidating in a triangle pattern visible on the 4-hour time frame after bouncing off the top. Price could be due for a test of support but could attempt another break past the triangle resistance. дальше »
2018-9-27 06:52 | |
|
|
Bitcoin Price Watch: BTC Broke Key Support, Could Test $6,275
Key Points Bitcoin price failed to hold the key support at $6,590 and declined below $6,500 against the US Dollar. There was a break below a bearish pattern with support at $6,550 on the hourly chart of the BTC/USD pair (data feed from Kraken). дальше »
2018-9-25 11:30 | |
|
|
Bitcoin (BTC) Price Watch: Back to Support Yet Again!
Bitcoin Price Key Highlights Bitcoin price has formed higher lows and lower highs to trade inside a triangle pattern on its 4-hour time frame. Price got rejected on a test of resistance once more and a move to support appears to be taking place. дальше »
2018-9-25 07:34 | |
|
|

Cryptocurrency Market Update: $15 Billion Dumped in 24 Hours
FOMO Moments Markets are bleeding once again; XRP, Stellar, Cardano and Siacoin getting smashed. As we have seen before the same pattern has resumed and the market rally could not be sustained. Cryptocurrencies have dumped again today wiping out all gains over the past few days. дальше »
2018-9-25 06:35 | |
|
|
Bitcoin (BTC) Price Watch: Reversal Pattern Confirmation on SEC Order
Bitcoin Price Key Highlights Bitcoin price looks ready to confirm its double bottom reversal formation as it tests the neckline. A break higher could lead to a rally that’s the same height as the chart formation, which spans $6,100 to $6,650. дальше »
2018-9-21 07:16 | |
|
|
Bitcoin (BTC) Price Watch: Volatility Picking Up Leading to Bitcoin ETF SEC Ruling
Bitcoin Price Key Highlights Bitcoin price tossed and turned around current support levels but is still on track to complete a double bottom pattern. Price is making its way closer to the neckline around the $6,600 level and a break higher could confirm an uptrend. дальше »
2018-9-20 07:44 | |
|
|
Bitcoin (BTC) Price Watch: Bullish Reversal Pattern Forming?
Bitcoin Price Key Highlights Bitcoin price appears to be gaining some traction off its recent bounce, possibly forming another double bottom. This is a classic reversal formation, so a rally could be due once price breaks past the $7,400 neckline. дальше »
2018-9-17 06:35 | |
|
|
Bitcoin Price Watch: BTC/USD Could Correct Lower To $6,400
Key Points Bitcoin price traded further higher above the $6,450 and $6,510 resistances against the US Dollar. There is a short term ascending channel in place with support at $6,505 on the hourly chart of the BTC/USD pair (data feed from Kraken). дальше »
2018-9-14 11:48 | |
|
|
Bitcoin Price Watch: BTC/USD Sets Eyes On $6,080
Key Points Bitcoin price declined slightly and settled below the $6,300 level against the US Dollar. There was a break below a short term triangle pattern with support at $6,320 on the hourly chart of the BTC/USD pair (data feed from Kraken). дальше »
2018-9-12 11:48 | |
|
|