Новости о Pattern Btc [ Фото новости ] [ Свежие новости ] | |

Bitcoin / USD Technical Analysis: Critical Round
Bitcoin has a bullish short-term outlook, with the BTC / USD pair regaining bullish momentum above the $5,100 level The four-hour time frame shows a bearish head and shoulders pattern The Ichimoku indicator on daily time frame is showing that the $5,200 level is an important pivot Bitcoin / USD Short-term price analysis Bitcoin has […] The post Bitcoin / USD Technical Analysis: Critical Round appeared first on Crypto Briefing. дальше »
2019-4-18 17:12 | |
|
|
Bitcoin: BARR Pattern suggests that BTC might have bottomed in 2018
A Twitter user suggested the formation of BARR [Bump and Run Reversal] Pattern, which suggests that Bitcoin already bottomed in the month of December 2018. According to Twitter user @thalamu_, Bitcoin hit bottom on December 15, 2018, when the price of Bitcoin fell as low as $3,126 [BitMEX]. дальше »
2019-4-17 16:45 | |
|
|
Bitcoin (BTC) Trend Overwhelmingly Positive As Bulls Eye $5,400
Bitcoin price formed a double bottom pattern near $4,940 and climbed higher against the US Dollar. Bulls pushed the price above the key $5,150 and $5,160 resistance levels. Yesterday’s highlighted major bearish trend line was breached at $5,110 on the hourly chart of the BTC/USD pair (data feed from Kraken). дальше »
2019-4-17 09:30 | |
|
|
Ethereum [ETH] and Tron [TRX] Price Analysis: Coins stumble as bear regains control of market
The cryptocurrency market’s return to the sideways movement pattern has discouraged many new investors and institutions from trying their hand at the field of digital assets. Popular cryptocurrencies like Bitcoin [BTC], Ethereum [ETH], and Tron [TRX] were all subjected to this price clamp, as evidenced by the stagnation of their market volume and market cap. дальше »
2019-4-16 15:30 | |
|
|
Analysts Expect Bitcoin to Climb Higher as BTC Forms Upwards Parabola Pattern
After picking up some steam this past Sunday, Bitcoin was able to approach the $5,200 level before dropping slightly. Although the previous drop – which sent BTC reeling back towards the lower-$5,000 region last week – seemed to mark the end of the surge, it now appears that the markets have further room to climb. дальше »
2019-4-16 03:00 | |
|
|
Bitcoin (BTC) Still on Track to Form Golden Cross Pattern Despite Recent Drop
The crypto markets have been able to halt their downwards descent, finding relatively strong levels of support slightly below their current price levels. Bitcoin (BTC) – which recently dropped into the $4,900 region after quickly advancing to $5,400 – has established its recent lows as a region of support and has since been able to. дальше »
2019-4-13 22:30 | |
|
|
Bitcoin (BTC) Price Signaling Bullish Continuation With Bulls In Control
Bitcoin price corrected lower recently and tested the $4,920 support area against the US Dollar. The price recovered nicely recently and traded above the $5,040 and $5,100 resistance levels. There is a major breakout pattern in place with resistance at $5,130 on the hourly chart of the BTC/USD pair (data feed from Kraken). дальше »
2019-4-13 07:08 | |
|
|
Bitcoin Could be Forming a “Golden Cross” Pattern, Is the Next BTC Bull Run Imminent?
Bitcoin has been able to continue inching higher after dropping below $5,200 earlier today, and is now approaching $5,300, which appears to be a slight level of resistance for the cryptocurrency. BTC’s upwards ascent has continued to allow many major altcoins to surge, with many cryptos trading up over 2% today. дальше »
2019-4-11 03:00 | |
|
|

Altcoins Start to Dump, Is Bitcoin Ready to Make a Big Move?
Back in 2017 a clear pattern emerged between Bitcoin and the altcoins. BTC was (and still is) the bellwether for the entire market, leading the peaks and troughs. However, they were also inversely correlated in. дальше »
2019-4-9 08:54 | |
|
|
Криптоаналитик Джош Рейджер: В июле нас ждёт уверенный рост цены биткоина
Трейдер и криптоаналитик Джош Рейджер предположил, что фаза накопления биткоина продлится до середины июля, затем последует уверенный рост цены. $BTC Accumulation Pattern It took Bitcoin 216 days for accumulation from bottom to spring in 2015 If this were accumulation, this week's $1000 candle would be the exact middle of 216 accumulation days and would end […] Запись Криптоаналитик Джош Рейджер: В июле нас ждёт уверенный рост цены биткоина впервые появилась Криптовалюта.Tech. дальше »
2019-4-7 16:23 | |
|
|
Аналитик: стремительный рост цены биткоина начнется в середине июля
Трейдер и криптоаналитик Джош Рейджер предположил, что фаза накопления биткоина продлится до середины июля, затем последует уверенный рост цены. $BTC Accumulation Pattern It took Bitcoin 216 days for accumulation from bottom to spring in 2015 If this were accumulation, this week’s $1000 candle would be the exact middle of 216 accumulation days and would end […] дальше »
2019-4-7 13:36 | |
|
|
BTC Accumulation Pattern Likely to Continue as Top Traders Share Their Bitcoin Predictions
Buying while prices are low is the ideal. Regardless of the recent BTC price spike, it is still 75% away from it's all-time high. The current market situation can likely be explained considering prior periods of accumulation. дальше »
2019-4-6 00:14 | |
|
|


Bitmain Announces Antminer s17 Date: Can It Turn the Company’s Fortunes Around?
Cryptomining manufacturer Bitmain has revealed the release date for its next-generation Antminer S17 series. The S17 set of miners includes the Antminer S17 Pro, Antminer S17 and the Antminer T17. дальше »
2019-3-30 23:28 | |
|
|
Bitcoin (BTC) Milestone, Trading Above a 5-Month Liquidation Line
Bitcoin price trading above $4,200 Crypto analyst places Bitcoin price at $55k after halving Number of confirmed Bitcoin transactions surge to 383,186 With a market cap of $71. 9 billion, Bitcoin (BTC) is trading in a bull breakout pattern above a five-month resistance line. дальше »
2019-3-30 21:00 | |
|
|
Bitcoin (BTC) Price Analysis: Bears Defend Resistance Again
Bitcoin has formed lower highs and higher lows to trade inside a symmetrical triangle pattern on the daily time frame. Price has once again been rejected at the triangle resistance, so it might be setting. дальше »
2019-3-12 06:44 | |
|
|

Bitcoin Price Analysis: New High Paves Potential Reversal Setup
After days and days of consolidation, bitcoin finally managed to break a new high for the first time in almost two weeks. This new high, so far, has been short lived, however, as it was almost immediately sold into by eager bears:Figure 1: BTC-USD, 4-Hour Candles, New HighOur current 4-hour candle is seeing a relatively easy retracement after days and days of an upward grind. дальше »
2019-3-9 02:08 | |
|
|
Bitcoin (BTC) Price Watch: Bullish Break Above $4,000 Looming
Bitcoin price is currently consolidating above the $3,820 and $3,840 supports against the US Dollar. The price placed in a positive zone, with a bullish angle towards the $4,000 resistance. There is a symmetrical triangle pattern formed with resistance at $3,880 on the hourly chart of the BTC/USD pair (data feed from Kraken). дальше »
2019-3-8 09:30 | |
|
|
Bitcoin (BTC) Price Analysis: Another Attempt at Neckline Break?
Bitcoin might be making another attempt to confirm the long-term double bottom reversal pattern as it heads back to test the neckline resistance. A break higher could confirm that a climb of the same height. дальше »
2019-3-8 06:59 | |
|
|

Report Claims That “Sextortionists” Absconded With Over $300,000 in Crypto in 2018
Most cyberattacks in the crypto space involve hackers finding a way around the security of crypto exchange platforms and gaining access to users’ funds. Last year saw the entry of a new breed of cyber extortionists that seems to be gaining ground, so much so that they were able to steal over $300,000 in bitcoin (BTC) tokens in 2018. дальше »
2019-3-1 18:10 | |
|
|
Bitcoin (BTC) Price Analysis: Just a Major Bullish Correction?
Bitcoin recently broke through the top of a symmetrical triangle consolidation pattern to signal that bulls are in control. However, resistance around $4,300 held and price is back down to the broken resistance. дальше »
2019-2-25 04:45 | |
|
|
Bitcoin Price Weekly Analysis: BTC’s Bullish Break Looks Real Towards $4,500
Bitcoin price extended gains and broke the $3,950 and $4,000 resistance levels against the US Dollar. The price traded to a new 2019 high above $4,100 and it could continue to rise in the near term. дальше »
2019-2-24 09:00 | |
|
|
Bitcoin Price Analysis: Bullish Setups Could Break Current Market Structure
The cryptomarket remains coiled as we lead into the weekend with no new highs and no new lows being established for bitcoin. However, it is nicely consolidating on lower time frames and hints toward the possibility of another leg up:Figure 1: BTC-USD, Hourly Candles, Consolidating PennantThe pattern shown in Figure 1 outlines a potential continuation pattern called a “bullish pennant. дальше »
2019-2-23 02:23 | |
|
|
Bitcoin [BTC] vs BitTorrent [BTT] Price: Newly Listed Token Outperforms the Original Cryptocurrency
Recently listed BitTorrent Token, BTT is outperforming top cryptocurrencies today with data from CoinMarketCap showing the token appreciating 5. 21% over the past 24 hours. The token which listed on Binance on the 31st of January quickly spiked upon listing showing ICO investors a significant return. дальше »
2019-2-21 18:14 | |
|
|
Bitcoin Price Watch: Pullback In BTC Before Fresh Increase
Bitcoin price extended gains above $3,900 and traded close to the $4,000 resistance against the US Dollar. The price traded as high as $3,973 and later started a downside correction. There is a short term breakout pattern in place with support at $3,875 on the hourly chart of the BTC/USD pair (data feed from Kraken). дальше »
2019-2-20 09:30 | |
|
|
Bitcoin Price Analysis: Consolidation Breaks Out Into Macro Resistance Test
Over the course of the last 10 days, bitcoin has managed to rally nearly 20% in value as it burst through two major resistance levels and is now beginning the test of a major macro level:Figure 1: BTC-USD, Daily Candles, Macro ResistanceWe can see a clear, descending supply-and-demand channel that governed the market for the last two months. дальше »
2019-2-20 01:38 | |
|
|
Bitcoin (BTC) Price Analysis: Reversal Pattern Confirmation, More Upside?
Bitcoin could be due for an even bigger climb as it breaks past the neckline of the complex inverse head and shoulders on the 4-hour time frame. Price is closing above the $3,900 mark and... The post Bitcoin (BTC) Price Analysis: Reversal Pattern Confirmation, More Upside? appeared first on Ethereum World News. дальше »
2019-2-19 06:39 | |
|
|

Bitcoin Price Breaks Medium-Term Resistance after Surging 8% Near $4,000
The Bitcoin market came back on its bullish track during the February 18’s trading session. The Bitcoin-to-Dollar rate (BTC/USD) on Monday established an intraday high towards 3917, up 8. 08% since the open. дальше »
2019-2-19 23:23 | |
|
|
Bitcoin (BTC) Price Analysis: Aiming for Triangle Top Next!
Bitcoin broke above its short-term descending channel to confirm that the climb is gaining traction. This also completes a breakout from the bullish flag continuation pattern, indicating that a climb of the same height as. дальше »
2019-2-18 08:13 | |
|
|
Bitcoin Technical Analysis – Will the BTC Bull Flag Happen?
Top analysts currently have mixed price prospects for the cryptocurrency market leader Bitcoin. Price failed to overcome a former high during a surge last week leading to a bearish market structure with a lower high. дальше »
2019-2-14 17:33 | |
|
|
Bitcoin (BTC) Price Analysis: A Closer Look at the Bullish Flag Levels
Bitcoin is still stuck in its bullish flag pattern and waiting for momentum to return while consolidating in a small channel. Looking closer at this channel shows the levels to watch to gauge a breakout or pullback. дальше »
2019-2-14 07:01 | |
|
|
Bitcoin (BTC) Price Analysis: Still Waiting for a Bullish Flag Break
Bitcoin is still treading sideways in a short-term consolidation that looks like a bullish flag pattern. This is around the top of the descending channel visible on the 4-hour time frame, which explains why there is a lot of resistance. дальше »
2019-2-13 06:36 | |
|
|

Markets Update: Leading Markets Break ATH Descending Trendlines
BTC price action has broken above a major long-term trendline stemming back to December 2017’s all-time highs. When looking at the 2014 – 2015 bear market, a similar move precipitated the final sell-off of the trend before price action moved into an accumulation pattern. дальше »
2019-2-8 12:19 | |
|
|
Bitcoin in Danger Zone? Traders Brace for BTC Fall to 12-Month Low as Market Drops 4%
In the last 24 hours, the prices of major crypto assets have fallen by more than 5 percent as the Bitcoin price declined by around 2 percent. In consideration of the pattern of BTC since early January of achieving lower highs across four consecutive weeks, some traders expect Bitcoin to test its 12-month low. дальше »
2019-2-7 13:49 | |
|
|
Bitcoin (BTC) Price Analysis: Downside Break and Another Leg Lower
Bitcoin broke below the bottom of its symmetrical triangle consolidation pattern to signal that further losses are in the cards. Price is also trading within a descending channel on the 1-hour time frame and is now aiming for support. дальше »
2019-2-6 07:29 | |
|
|
Bitcoin Price Analysis: BTC at $4,500 Not an Impossibility
Bitcoin Price up 1. 8 percent, double-bar bull reversal pattern prints Fidelity Investment custodial services set for March Transactional volumes expected to rise in days ahead Three months after announcing their interest in crypto, Fidelity Investment will set out and roll out Bitcoin custody in three months. дальше »
2019-1-30 22:00 | |
|
|
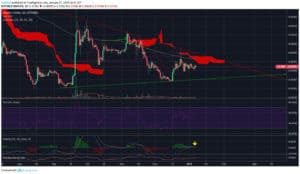
Bitcoin (BTC) Price Analysis: Reversal Formation Gives Bulls Hope
Bitcoin is bouncing off support at the bottom of its descending channel on the 1-hour time frame and a small reversal pattern is also forming. An inverse head and shoulders can be seen and a break above the neckline could confirm that a rally is in the works. дальше »
2019-1-18 06:00 | |
|
|
Bitcoin Price Weekly Analysis: BTC’s Bullish and Bearish Scenarios Analyzed
Bitcoin price declined recently and traded below the $3,725 support against the US Dollar. There is a short term breakout pattern forming with resistance near $3,650 on the 4-hours chart of the BTC/USD pair (data feed from Kraken). дальше »
2019-1-13 09:00 | |
|
|
Bitcoin (BTC) Price Analysis: Bears Still Not Done!
Bitcoin was previously trending higher inside a wedge pattern but has since broken lower to signal that sellers aren’t quite done yet. The wedge spans $3,700 to around $4,200 so the resulting drop could be of at least the same size. дальше »
2019-1-11 06:58 | |
|
|
Will Bitcoin [BTC] Follow Litecoin’s Lead Again?
After a brief consolidation yesterday, Litecoin continued its surge which it started on Sunday. The initial surge was preceded by an inverse head and shoulders pattern, and after increasing 10% against the USD, other major cryptocurrencies started following. дальше »
2019-1-8 18:29 | |
|
|
Bitcoin (BTC) Price Analysis: Revisiting Support at $4,000
Bitcoin is still consolidating in its triangle pattern visible on the 4-hour chart after recently getting rejected at $4,200. Price looks ready for another test of support that lines up with several potential inflection points. дальше »
2019-1-8 07:16 | |
|
|
Price Analysis: Bitcoin, Ethereum, XRP, Stellar, Litecoin, Cardano, EOS, IOTA, Tron, and Dogecoin
Bitcoin [BTC] Price Analysis: A look at the Daily chart for Bitcoin shows that price is currently trading at the $4100 level. Price is trying to make a reverse head and shoulders pattern with a neckline at $4440, coinciding with the 0. дальше »
2019-1-8 21:39 | |
|
|
Bitcoin (BTC) Price Analysis: Bulls Test Triangle Top Again!
Bitcoin has formed lower highs and higher lows to create a symmetrical triangle pattern on its 4-hour time frame. Price recently tested support and has bounced back up to the triangle top, perhaps to attempt another break higher. дальше »
2019-1-7 05:20 | |
|
|
Bitcoin (BTC) Price Analysis: Back to Support, Bulls Overpowered?
Bitcoin is still stuck in its symmetrical triangle consolidation pattern after getting rejected on the test of resistance. Price is nearing the bottom of the triangle around the $3,900 mark and a break lower could signal that bears have gotten the upper hand. дальше »
2019-1-4 05:39 | |
|
|
Bitcoin Price Analysis: Range-Bound Market Coiled for Next Move
For the better part of a month and a half, bitcoin has been fairly range-bound and unable to establish new lows or new highs. There are some bullish and bearish setups on the horizon for bitcoin, so let’s check out both sides of the argument because currently the market is sitting in the middle of Indecisionville — the most immediate sign of which is this glaringly obvious head-and-shoulders bottom reversal pattern:Figure 1: BTC-USD, Daily Candles, Head-and-Shoulders BottomThis current pattern is nothing more than a setup at the moment, but it represents one potential outcome of this sustained consolidation. дальше »
2019-1-4 02:22 | |
|
|
Does an Ascending Triangle for Bitcoin [BTC] Mean Price is Finished Bottoming Out?
Cryptocurrencies have had a bullish start to 2019 after an extremely bearish finish to 2019. The market leader is Bitcoin is forming an ascending triangle pattern on the daily. An ascending triangle is a bullish continuation pattern which is formed by both an upward trend line and a point of resistance. дальше »
2019-1-3 17:47 | |
|
|
Bitcoin (BTC) Price Analysis: Another Breakout To Look Out For
Bitcoin has also formed a triangle chart pattern which might show an earlier breakout as a preview for its reversal formation. Price has bounced off the triangle bottom and might be due for a test of resistance at the $4,200 mark next. дальше »
2019-1-3 06:06 | |
|
|
Bitcoin (BTC) Price Analysis: Larger Reversal Pattern Forming
Bitcoin might be ready for a longer-term climb as it forms an inverse head and shoulders pattern on its 4-hour time frame. Price has yet to test and break past the resistance but if it does, bitcoin could be in for a climb that’s the same height as the chart formation. дальше »
2019-1-2 05:10 | |
|
|
Bitcoin Price Watch: BTC Primed To Gain Bullish Momentum
Key Points Bitcoin price recently tested the $3,950-4,000 resistance area against the US Dollar. There is a key breakout pattern in place with resistance at $3,800 on the hourly chart of the BTC/USD pair (data feed from Kraken). дальше »
2018-12-31 09:00 | |
|
|