Новости о Move Breakout [ Фото новости ] [ Свежие новости ] | |

Ethereum Price Analysis: ETH Bullish Case For Breakout Above $140
ETH price started a solid upward move and traded above the $138 resistance against the US Dollar. The price tested the $140 resistance and it seems like there could be more gains. There is an ascending channel in place with support at $138 on the hourly chart of ETH/USD (data feed via Kraken). дальше »
2019-3-28 07:08 | |
|
|

Bitcoin Price Analysis: Slow Upward Drift Tests Market Supply
A slow, grinding upward drift has been the name of the game for bitcoin’s market over the last few weeks. The upward drift is bringing us slowly to a level that was previously rejected violently:Figure 1: BTC-USD, Daily Candles, Upward DriftOur third rejection of the red resistance level shown above brought the market into a test of macro support in the mid-$3,000s. дальше »
2019-3-23 01:23 | |
|
|
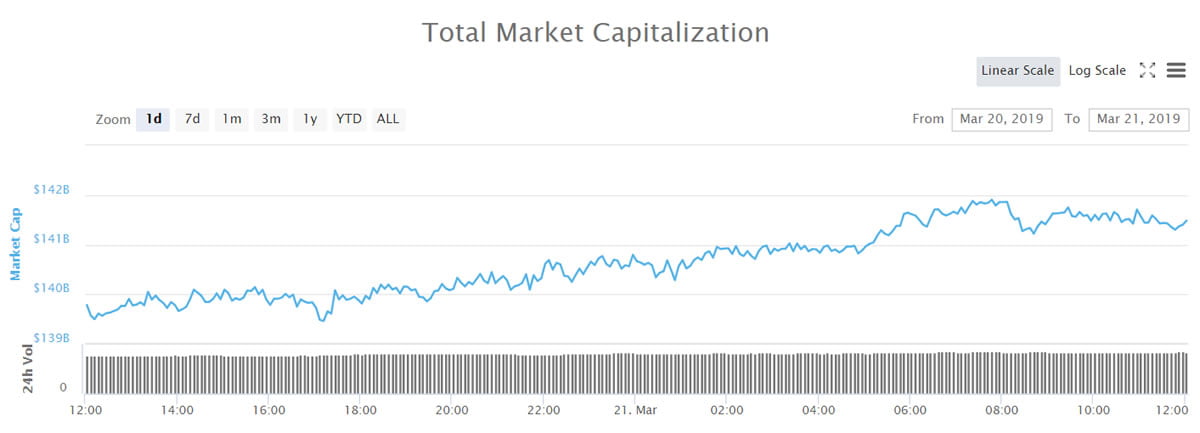
Crypto Markets at Monthly High, When Will They Breakout?
Crypto markets have crept back to monthly high; majors flat but Ontology, Tezos and Ravencoin ripping. Market Wrap Crypto markets have been slowly gathering momentum with some larger gains for some of the altcoins. дальше »
2019-3-21 10:00 | |
|
|
Bitcoin Price Analysis: Slow Grind Could Lead to Short Squeeze
Last Friday, we discussed a macro resistance level bitcoin would likely test. The level was tested three times prior and immediately rejected. Now, for the fourth time, we find ourselves situated above the level as we wait to see if our support holds:Figure 1: BTC-USD, Daily Candles, Fourth Test of Macro ResistanceThe first three attempts to hold support above the black, broken resistance have been stifled with relatively high amounts of volume. дальше »
2019-3-19 01:17 | |
|
|
Bitcoin Won’t Be $3,000 Cheap Again, Crypto To Trend Higher In April
Analyst Awaits Bitcoin Breakout Each and every day, the cryptocurrency market trades. More often than not, it seems to move in a random manner, with Bitcoin (BTC), Ethereum, or whatever other flavors of the week. дальше »
2019-3-18 10:11 | |
|
|
Quick Crypto Facts: Bitcoin Bears Getting Tough Competition, Are We Ready for a BTC Breakout?
We are currently in the longest bear market ever after Bitcoin hit $20,000 in December 2017. Since then, Bitcoin has been constantly moving down seeing the low of $3,200 in December 2018. We have yet to see a bull rally as Bitcoin hasn't been able to move above the $4,200 level, being stuck in the […] дальше »
2019-3-8 19:53 | |
|
|
Bitcoin Price Analysis: Short-Term Support Breaks on High Volume and Spread
Leading into the London open, bitcoin broke through its local support level in a move that seems to be hinting toward a downward continuation:Figure 1: BTC-USD, Daily Candles, Broken Local SupportSo far, our daily candle has yet to close, but it is currently on schedule to close below local support. дальше »
2019-3-5 02:43 | |
|
|
Bitcoin Price Analysis: Keep an Eye Out for a Close Above the Current High
Shortly after falling from its test of the low $4,000s, bitcoin managed to find support in the mid $3,500s. This has proven to be a relevant level over the last few months, and finding support here would be a sign of relatively strong demand:Figure 1: BTC-USD, Daily Candles, Local SupportThe high candle spread rejection following our test of the low $4,000s was an indication that we had strong levels of supply left in the market, but for the time being we are holding support. дальше »
2019-3-1 03:44 | |
|
|
Ripple Price Analysis: XRP Turned Bearish Again, Could Retest $0.3000
Ripple price failed to break the $0. 3380 and $0. 3400 resistance levels against the US dollar. The price traded lower and broke the $0. 3220 and $0. 3200 support levels to move into a bearish zone. дальше »
2019-2-27 08:00 | |
|
|
Ethereum Price Analysis: ETH Targets Fresh Weekly Lows Below $130
ETH price failed to move above the $140 and $142 resistance levels against the US Dollar. The price broke the $136 support and it seems like it could continue to move down in the near term. Yesterday’s highlighted key breakout pattern was breached with support at $136 on the hourly chart of ETH/USD (data feed. дальше »
2019-2-27 07:08 | |
|
|
Bitcoin Price Analysis: Bullish Rejection Wipes Out Bitcoin’s Weekend Gains
Over the weekend, a strong rally was stifled by an even stronger rejection as the bitcoin market was shoved into a band of overhanging resistance. This band of resistance has been mentioned several times in our analyses over the last few weeks as it has proven impossible to overcome for the time being:Figure 1: BTC-USD, Daily Candles, Failed BreakoutThis run to the low $4,000s coincided with a breakout of a rather large symmetrical triangle consolidation shown above. дальше »
2019-2-26 02:42 | |
|
|
Bitcoin Price Analysis: Bullish Setups Could Break Current Market Structure
The cryptomarket remains coiled as we lead into the weekend with no new highs and no new lows being established for bitcoin. However, it is nicely consolidating on lower time frames and hints toward the possibility of another leg up:Figure 1: BTC-USD, Hourly Candles, Consolidating PennantThe pattern shown in Figure 1 outlines a potential continuation pattern called a “bullish pennant. дальше »
2019-2-23 02:23 | |
|
|
Bitcoin Price Analysis: Consolidation Breaks Out Into Macro Resistance Test
Over the course of the last 10 days, bitcoin has managed to rally nearly 20% in value as it burst through two major resistance levels and is now beginning the test of a major macro level:Figure 1: BTC-USD, Daily Candles, Macro ResistanceWe can see a clear, descending supply-and-demand channel that governed the market for the last two months. дальше »
2019-2-20 01:38 | |
|
|
EOS Price Prediction: Price Is Possibly Moving in an Ascending Triangle, Is the Breakout Occurring?
Long-Term Outlook A look at the Weekly chart for EOS shows that price is trading inside the minor resistance area at $3. The price is trading below the 21,50 period MA and the Ichimoku Cloud. After the breakdown at $5, price bottomed near $2 and quickly launched an upward move. дальше »
2019-2-18 15:09 | |
|
|
IOTA Price Prediction: Finally Arriving at the Breakout of the Wedge
Long-Term Outlook A look at the Weekly chart for IOTA in logarithmic form shows that price touched the resistance area at $0. 18-$0. 22 and immediately started an upward move to the next resistance area at $0. дальше »
2019-1-30 18:04 | |
|
|
Bitcoin Price Analysis: Strong Move Likely Following Tightly Coiled Market
Days and days of sideways consolidation and tightening volume has been the name of the game for the bitcoin market. A narrow range of $200 has caused a weeks worth of activity to coil and consolidate in preparation for bitcoin’s next move:Figure 1: BTC-USD, Daily Candles, Narrow RangeThe figure above shows just how narrow the range has been over the last week as the market has continued to grind out support and fail to break above overhanging resistance. дальше »
2019-1-26 03:13 | |
|
|
Bitcoin Price Weekly Analysis: BTC’s Bullish and Bearish Scenarios Analyzed
Bitcoin price declined recently and traded below the $3,725 support against the US Dollar. There is a short term breakout pattern forming with resistance near $3,650 on the 4-hours chart of the BTC/USD pair (data feed from Kraken). дальше »
2019-1-13 09:00 | |
|
|
Bear Flag Forms for Bitcoin [BTC] as Price Drops Below Support
The price of Bitcoin recorded an extremely bearish move in yesterdays price action. Price broke from a consolidation it had been forming all week between $4075 and $3900. Price has now broken below another key level around $3670. дальше »
2019-1-11 18:19 | |
|
|
Ripple Price Analysis: XRP Eyeing Upside Break Above $0.37
Ripple price tested the key support near $0. 3600 and later recovered against the US dollar. There is a crucial breakout pattern forming with resistance at $0. 3680 on the hourly chart of the XRP/USD pair (data source from Kraken). дальше »
2019-1-9 08:00 | |
|
|
Bitcoin Price Analysis: Range-Bound Market Coiled for Next Move
For the better part of a month and a half, bitcoin has been fairly range-bound and unable to establish new lows or new highs. There are some bullish and bearish setups on the horizon for bitcoin, so let’s check out both sides of the argument because currently the market is sitting in the middle of Indecisionville — the most immediate sign of which is this glaringly obvious head-and-shoulders bottom reversal pattern:Figure 1: BTC-USD, Daily Candles, Head-and-Shoulders BottomThis current pattern is nothing more than a setup at the moment, but it represents one potential outcome of this sustained consolidation. дальше »
2019-1-4 02:22 | |
|
|

Bitcoin Price Analysis: Bear Pennant Breakout Puts $1,700 Price in Sight
Another week, another low. Bitcoin’s market has been bleeding relentlessly for weeks and now, after falling 50% in value in just one month, the market has managed to break south of a major bearish consolidation pattern called a bear pennant:Figure 1: BTC-USD, 4-Hour Candles, Bear Pennant BreakoutThis is a massive bear pennant with a staggering $2,000 measured move. дальше »
2018-12-12 01:52 | |
|
|
Bitcoin Price Analysis: Another Red Day Pushes BTC Into Deeper Support Test
Bitcoin has tumbled again today as the market continues to see further downward movement shortly after breaking two areas of market support. So far, bitcoin is down 15% on the day — 25% in 1 week:Figure 1: BTC-USD, Daily Candles, Downward ContinuationThis drop below support is starting to display hallmarks of market capitulation. дальше »
2018-11-20 02:27 | |
|
|
Bitcoin Price Analysis: Yearly Support Breaks as Bitcoin Tests Underlying Demand
After months and months of consolidation, the yearly support finally broke and now bitcoin has found itself in the lower $5000s for the first time since 2017:Figure 1: BTC-USD, Daily Candles, Broken SupportBitcoin managed to drop a staggering 16% yesterday as the market sliced through the long held support like a knife through butter. дальше »
2018-11-16 01:28 | |
|
|
Bitcoin (BTC) Futures Volatility Hits All-Time Low, Yet Crypto Moves Higher
Bitcoin (BTC) Volatility Continues Lower After weeks stuck in a range, Bitcoin (BTC) saw a semblance of a breakout on Tuesday, as the prominent crypto asset broke convincingly over $6,500 in a move backed by hefty levels of volume — a seldom seen sight in 2018’s bear market — and positive investor sentiment. дальше »
2018-11-7 12:16 | |
|
|
Bitcoin Price Analysis: Weekly Consolidation Hints Toward Sustained Breakout
Another week has passed as bitcoin continues to coil in a tighter and tighter consolidation. Both price and volume continue to consolidate as bitcoin decides where the next major move will be. дальше »
2018-10-31 00:19 | |
|
|
Bitcoin Price Update: Breakout Imminent as Price Looks to Move Beyond Descending Triangle
Bitcoin looks set for an imminent price breakout. The price action chart for the top-ranked cryptocurrency shows a classic breakout pattern which could potentially signal an end to the sideways trading of the last two months. дальше »
2018-10-8 19:45 | |
|
|

Bitcoin Price Watch: Currency Still Unmoving, though a Breakout Is Still Possible
At press time, the father of cryptocurrency is still trading in the $6,500 range. Nothing has been altered in bitcoin’s present course; it’s stayed in this range for the past several days and isn’t looking to move. дальше »
2018-10-7 00:48 | |
|
|
Monero (XMR) Price Watch: Correction After Major Bullish Breakout
Monero Price Key Highlights Monero price recently busted through a descending trend line on the daily time frame to signal a major reversal. However, price hit a roadblock near $150 and is pulling back to the broken resistance. дальше »
2018-9-12 07:28 | |
|
|
Bitcoin Price Watch: BTC/USD Approaching Next Key Break
Key Points Bitcoin price is preparing for the next move with resistances near $6,385 and $6,530 against the US Dollar. Yesterday’s highlighted major breakout pattern is still active with resistance at $6,385 on the hourly chart of the BTC/USD pair (data feed from Kraken). дальше »
2018-9-11 11:48 | |
|
|
Bitcoin Price Watch: BTC/USD Remains At Risk Below $6,500
Key Points Bitcoin price is currently consolidating below a major resistance at $6,500 against the US Dollar. There is a short-term breakout pattern in place with resistance at $6,380 on the hourly chart of the BTC/USD pair (data feed from Kraken). дальше »
2018-9-10 11:48 | |
|
|
Bitcoin Price Watch: BTC/USD Forming Breakout Pattern Above $6,600
Key Points Bitcoin price is trading in a contracting range with support above the $6,600 level against the US Dollar. There is a major contracting triangle in place with resistance around $6,740 level on the hourly chart of the BTC/USD pair (data feed from Kraken). дальше »
2018-8-28 11:48 | |
|
|
Bitcoin (BTC) Price Watch: Look Out for a Wedge Breakout
Bitcoin Price Key Highlights Bitcoin price is consolidating inside a rising wedge and is nearing the peak of the pattern. Price could break out of the formation anytime soon, signaling which direction a longer-term move might go. дальше »
2018-8-27 06:53 | |
|
|
Bitcoin Awaits Decisive Move as Price Range Tightens
Bitcoin's corrective rally from the recent low of $5,859 would resume on bull pennant breakout. дальше »
2018-8-20 14:00 | |
|
|
Litecoin Price Analysis: LTC/USD Could Resume Its Decline
Litecoin price corrected higher above the $58. 00 level against the US Dollar. LTC/USD failed to break the $60. 00 resistance and is currently moving lower. Key Talking Points · Litecoin price failed to move above the $60. дальше »
2018-8-16 07:32 | |
|
|
Stellar Lumens (XLM) Could Be On The Verge Of A Massive Breakout
Stellar Lumens (XLM) is currently at a very interesting point where it can be expected to record massive gains from here on out. The last time Stellar (XLM) had a similar price action; it made a 33x move! As the current market correction draws to an end, Stellar (XLM) looks all set to lead the altcoin rally from this point. дальше »
2018-7-12 18:00 | |
|
|
Bitcoin Price Analysis: Breakdown of Consolidation Tests Bullish Resolve
In the previous BTC-USD market analysis, we discussed a macro pattern forming, called a “symmetrical triangle. ” A symmetrical triangle (shown in red) is a directionally agnostic consolidation pattern. дальше »
2018-6-13 00:05 | |
|
|
Bitcoin (BTC) Price Watch: Can Bulls Defend the Triangle Bottom?
Bitcoin Price Key Highlights Bitcoin is still inside its descending triangle visible on the daily chart. Price is testing support and is approaching the peak of the formation to signal an imminent breakout. дальше »
2018-6-11 07:57 | |
|
|