Новости о Indicators Technical [ Фото новости ] [ Свежие новости ] | |

Algorand (ALGO) Climbs to Revisit $0.70 Resistance
Technical indicators support the possibility of a breakout for both the ALGO-USD and BTC pairs. Algorand Approaches All-Time High The upward move resulting from the March 2020 lows took ALGO to a high of $0. дальше »
2021-2-2 16:14 | |
|
|
Solana (SOL) Climbs to New All-Time High Price
Technical indicators and the wave count support the continuation of the upward move for Solana. New Solana All-Time High SOL has been moving upwards since reaching a low of $1. 01 on Dec. 23, 2020. дальше »
2021-2-2 12:30 | |
|
|
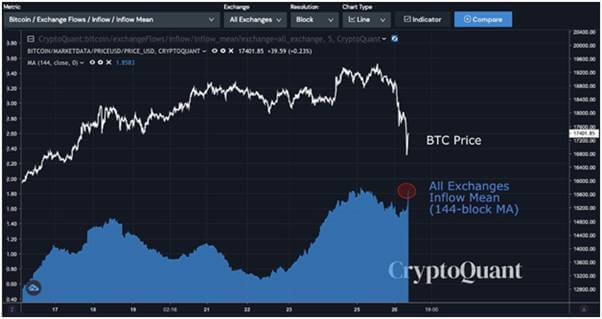
More Capital Ready to Enter Bitcoin, Reveals On-Chain Indicators
A technical bias conflict in the Bitcoin market is looking to influential on-chain indicators for cues—and most of them are favoring bulls. дальше »
2021-2-2 08:48 | |
|
|

XLM pumps and dumps: What’s next for Stellar?
Stellar (XLM) surged as much as 33% in just one hour as several technical indicators turned bullish, but quickly lost almost all of it as the day progressed. What’s next in the store for Stellar and should you consider buying XLM? Fundamental analysis: fundamentals stay the same, technicals caused the pump Stellar is a Ripple […] The post XLM pumps and dumps: What’s next for Stellar? appeared first on Invezz. дальше »
2021-1-30 21:12 | |
|
|
Bitcoin's unexpected price surge sees >$558M shorts liquidated
Until a few hours ago, Bitcoin's price was expected to continue stagnating on the charts. With most of the cryptocurrency's technical indicators wearing a bearish hue, many in the community expected tThe post Bitcoin's unexpected price surge sees >$558M shorts liquidated appeared first on AMBCrypto. дальше »
2021-1-29 18:30 | |
|
|
AAVE Price Analysis - Bullish fundamental and technical indicators
Similar to other crypto-based borrowing and lending platforms, AAVE has quickly become an integral part of the DeFi ecosystem. дальше »
2021-1-28 14:01 | |
|
|
Chainlink (LINK) Pumps to New All-Time High in a Bullish Resurgence
Technical indicators are still bullish and suggest that Chainlink is expected to continue increasing to reach even higher. Chainlink All-Time High Price On Jan. 15, 2021, LINK broke out above the previous all-time high. дальше »
2021-1-26 14:25 | |
|
|
ONT Approaches Long-Term Resistance Line – Break Out Imminent?
However, neither the price move nor technical indicators confirm the possibility of a breakout. Long-Term Levels ONT has been following a descending resistance line since Sept. 2018, when it was trading at a high of $2. дальше »
2021-1-20 19:31 | |
|
|
NANO Pumps but Fails to Clear Crucial Resistance
While the longer-term trend seems to be bullish, the lack of structure and ambiguity in technical indicators makes the direction of the short-term trend unclear. NANO Long-Term Levels NANO began a significant upward move in the final week of December 2020, concluding with a high of $5. дальше »
2021-1-20 15:15 | |
|
|
Ethereum Celebrates New All-Time High After Three Years
While the price action and technical indicators are still bullish, Ethereum is likely to reach a high between $1,500-$1,660 to complete a bullish impulse that began in March 2020. Ethereum All-Time High Ethereum has been increasing since a local low of $86 was reached in March. дальше »
2021-1-20 19:08 | |
|
|
COTI Aims to Break Out From 150 Day Resistance
Technical indicators and the short-term price action support the possibility of a breakout for COTI, which could further accelerate the rate of increase. Potential Breakout COTI has been moving upwards since it reached a low of $0. дальше »
2021-1-19 20:03 | |
|
|

Demand for Ethereum hits rooftop, price could quadruple within 90 days
Bitcoin bulls are calling $50,000 for the next rally. Ethereum bulls are also just as optimistic, as fundamental indicators are looking as promising as technical indicators. These key signals imply that a bullish rally, despite price stagnation is imminent and includes the sky-high demand for Ethereum’s ETH, which analysts claim will unseat supply in the […] дальше »
2021-1-16 13:45 | |
|
|
BTCD Continues Descent After Rejection
Rejection From Long-Term Resistance During the week of Dec. 27 – Jan. 4, BTCD fell from the long-term 71. 5% resistance area. It has not traded above this level since June 2017. Despite the rejection, technical indicators are still bullish. дальше »
2021-1-11 23:03 | |
|
|

Ethereum Analyst Predicts Record High against Eerie Bearish Setups
Ethereum’s native token ETH fell by more than 20 percent from its session high of $1,350 on profit-taking sentiment. While technical indicators point to further correction lower, one analyst believes the second-largest cryptocurrency could hit its record high levels in the sessions ahead. дальше »
2021-1-11 16:04 | |
|
|
Solana (SOL) Attempts To Break Out Above $2.50 Resistance
Technical indicators and the wave count support the possibility of a breakout that could eventually lead Solana to a high near $5. Solana Bounces Above Support The SOL price has been decreasing since Sept. дальше »
2021-1-7 13:37 | |
|
|
Bitcoin Continues Clawing Its Way Toward $40,000
Despite a lack of weakness from technical indicators, the wave count suggests that Bitcoin is nearing the top of its move, with a possible target near $39,100. Bitcoin Reaches Another All-Time High BTC created yet another bullish candlestick on Jan. дальше »
2021-1-7 11:32 | |
|
|
ETC Makes Fifth Attempt to Break Out Above $7.40
Both technical indicators and the wave count support the possibility of a breakout, which would take ETC to at least $9. 30. Long-Term Resistance ETC has been trading below the $7. 40 resistance area since the rapid decline in March. дальше »
2021-1-6 17:47 | |
|
|
SXP Risks Falling to All-Time Low, Will It Bounce?
However, technical indicators are bullish, suggesting that SXP will break out instead. Long-Term Resistance Line SXP has been decreasing rapidly since reaching a high of $5. 14 on Aug. 14. The fall has been swift, and SXP has been following a descending resistance line since Sept. дальше »
2021-1-6 21:30 | |
|
|
BAL’s Breakout Could Pave the Way for Higher Prices
The breakout from the former is significant, and when coupled with the bullish readings from technical indicators, it suggests that an upward move is likely. Long-Term Levels The daily chart shows that BAL had been following a descending resistance line since Sept. дальше »
2020-12-29 21:49 | |
|
|
0x (ZRX) Finds Relief Above Crucial Support
Despite ambiguity from technical indicators, 0x is expected to increase to the closest resistance area at $0. 425 and could possibly move higher after. 0x Long-Term Support Levels ZRX has been moving downwards since it reached a high of $0. дальше »
2020-12-29 13:27 | |
|
|
Bitcoin Creates Double Top After Second Failed Attempt at $24,000
However, technical indicators are not all that bearish. Bitcoin is expected to reverse its trend at one of the support levels examined below. Bitcoin Trend Weakens Slightly Yesterday, the BTC price reached a high of $24,100 in another attempt at reaching a new all-time high. дальше »
2020-12-24 10:27 | |
|
|
Ethereum Classic (ETC) Struggles to Overcome $7.50 Resistance
The price action and a variety of technical indicators suggest that ETC will be successful in breaking out. Ethereum Classic Long-Term Support Levels ETC has been following an ascending support line since November 2018 and has validated it four times since. дальше »
2020-12-21 13:21 | |
|
|
What Does BTCD Say About Another Altseason?
Technical indicators are bullish and support the possibility of a breakout. BTCD’s Long-Term Resistance BTCD is currently trading above a long-term resistance line that has been in place since Sept 2019. дальше »
2020-12-18 21:55 | |
|
|
WAVES Drops Shortly After Reaching New Yearly High
Technical indicators and the wave count suggest that this is the most likely possibility. WAVES Reaches New Yearly High The WAVES price has been increasing alongside a parabolic ascending support line since the beginning of Oct. дальше »
2020-12-10 18:05 | |
|
|
TOMO Fails to Break Out Again, What’s Next?
Technical indicators are bearish, suggesting that another drop towards the support area outlined below is likely before the price makes another breakout attempt. TOMO Attempts to Break Out TOMO has been following a descending resistance line since it reached a high of $1. дальше »
2020-12-10 20:04 | |
|
|
Litecoin Price Analysis - Continued bullish technical indicators
Technicals for the LTC/USD pair reveal bullish trend metrics with the spot price above both the 200-day EMA and daily Cloud. The most significant upside resistance sits at US$70 based on the yearly pivot and VPVR. дальше »
2020-12-10 14:01 | |
|
|

Bitcoin “Double Top” Narrative Builds, Factors To Potentially Fear
Bitcoin price is in a precarious location. The asset set a new all-time high just days ago but is trading below the record and starting to decline. The shifting momentum is now presenting in technical indicators supplying bearish signals, adding to the double top narrative that’s been building since failing to break $20,000. Here are […] дальше »
2020-12-9 23:00 | |
|
|
OCEAN Breaks Down and Struggles to Maintain Support
While OCEAN is trading just above a minor support area, technical indicators suggest that it will break down and head towards the support areas outlined in the article. OCEAN Breakdown From Support The OCEAN price had been following an ascending support line since reaching a low of $0. дальше »
2020-12-8 22:33 | |
|
|

Ten Different Bearish Divergences Stack Against Bitcoin, But Drop Has Yet To Arrive
Bitcoin has been unstoppable from Q2 2020 on, bringing the asset to a new all-time high and restoring interest and bullish momentum in the cryptocurrency market. But as the most dominant crypto asset in the space continues to climb with very few corrections in between, ten of the most widely used technical indicators are now […] дальше »
2020-12-3 23:00 | |
|
|
VeChain (VET) Bounces Up and Aims for Nearest Resistance
Despite the corrective short-term pattern that VeChain has been trading in, technical indicators are bullish and support the possibility that the upward movement will continue. VeChain Re-Tests Support The VET price has been moving upwards since Nov. дальше »
2020-12-1 15:09 | |
|
|
DASH Price Analysis - USD market flips bullish
Technical indicators for the DASH/USD market pair have flipped from bearish to bullish over the past few days. The current spot price is now above both the 200-day EMA and daily Cloud. дальше »
2020-12-1 14:01 | |
|
|
The Ripple Effect: 5 Key Factors Behind The 100% XRP Surge
After spending three years of the crypto bear market as the butt of all jokes, being compared to sheep manure, and much more, XRP has shocked the entire industry with a 225% single-month explosion. But the powerful breakout could only be just beginning, according to a variety of technical indicators that measure the strength of […] дальше »
2020-11-25 23:00 | |
|
|

Another significant bullish market trend that could catapult Bitcoin’s price to new highs
Technical indicators may suggest that Bitcoin is currently staggering between gains and losses, but fundamental patterns are suggesting otherwise. The new fundamental signal according to Glassnode’s report implies that selling pressure is reducing drastically. дальше »
2020-11-24 23:03 | |
|
|
CME Group Volatility Indexes (CVOL) – FAQ
Table of contents What are the CME Group Volatility (CVOL) Indexes? How do the CVOL Indexes work? What is the calculation methodology for CVOL Indexes? What is simple variance? What are the additional indicators that are calculated? What is UpVar? What is DnVar? What is Skew? Which CME Group products will have their own CVOL Index and indicators? What time of day are CVOL Indexes available? When will CVOL Indexes be offered as real-time indexes? Are CVOL Indexes IOSCO-compliant benchmarks? What kind of oversight applies to CVOL Indexes? Where can I find additional information about CVOL Indexes? How can I access the index data? Where can I find technical details surrounding the CVOL calculation methodology? Will CVOL Indexes be available for licensing? Can I receive this data through a third party like Bloomberg and Refinitiv or do I need to get it from CME Group directly? дальше »
2020-11-20 01:01 | |
|
|
Litecoin Price Analysis - Bullish technical indicators
Technicals for the LTC/USD pair reveal bullish trend metrics with price above both the 200-day EMA and daily Cloud. дальше »
2020-11-10 14:01 | |
|
|
Bitcoin Wave Count Suggest One Final Upward Move
The Bitcoin (BTC) price is nearing the top of a bullish impulse that has been transpiring since the beginning of March. Technical indicators suggest that BTC may make at least one more upward move to complete the pattern before reaching a top. дальше »
2020-11-10 13:41 | |
|
|
Bitcoin (BTC) Double-Top Could Lead to a Short-Term Retracement
The Bitcoin (BTC) price has increased significantly over the past two weeks but has created a bearish pattern in the short-term. Technical indicators are also showing weakness, indicating a retracement could be in the cards. дальше »
2020-11-2 13:21 | |
|
|
Cardano (ADA) Fails to Overtake Crucial Resistance Level
Cardano (ADA) has failed to break out above a long-term descending resistance line and suffered a sharp drop after its rejection. Technical indicators suggest that the price is likely to continue its descent. дальше »
2020-10-30 10:31 | |
|
|
Cardano, NEM, VeChain Price Analysis: 24 October
With Bitcoin seemingly consolidating just below the $13,000-level, buying momentum for most alts has also subsided over the weekend. In fact, technical indicators for NEM and VeChain turned neutralThe post Cardano, NEM, VeChain Price Analysis: 24 October appeared first on AMBCrypto. дальше »
2020-10-25 23:00 | |
|
|
IOTA, EOS, FTX Token Price Analysis: 21 October
With a bullish sentiment reaffirmed by EOS’s technical indicators, the altcoin was on its way to breach a key resistance level over the next few trading sessions. IOTA traders speculated the riseThe post IOTA, EOS, FTX Token Price Analysis: 21 October appeared first on AMBCrypto. дальше »
2020-10-22 21:30 | |
|
|
Binance Coin, Tezos, DASH Price Analysis: 20 October
Despite its 10% gain over the day and being a top-performing asset, the bull market in DASH was likely to turn around soon, as key technical indicators hinted towards a price correction. Binance CoThe post Binance Coin, Tezos, DASH Price Analysis: 20 October appeared first on AMBCrypto. дальше »
2020-10-20 21:30 | |
|
|