Новости о Fractal Price [ Фото новости ] [ Свежие новости ] | |

Bitcoin’s fractal nature allows extrapolation of 2017 price pattern; predicts correction in the next two days
Bitcoin has been called a lot of names. From a bubble to a Ponzi scheme, to Tulip-mania and a scam. Nevertheless, it has never ceased to amaze and prove all naysayers wrong. The pattern that Bitcoin’s price is following is quite similar to Gold’s prices from 1979 to 2000, the DotCom bubble from 1997 to 2002, […] The post Bitcoin’s fractal nature allows extrapolation of 2017 price pattern; predicts correction in the next two days appeared first on AMBCrypto. дальше »
2019-6-27 17:07 | |
|
|
Bitcoin (BTC) Will Soon Blast by 80% to $30,000 Should Fractal Play Out
Bitcoin Ready for $30,000. What? To say that the Bitcoin price action on Wednesday has been crazy would be somewhat of an understatement. For those who missed the memo, BTC found itself up 20% at. . дальше »
2019-6-27 10:56 | |
|
|
Following Gold Fractal Would Bring Bitcoin Price to ATH, $16K is Coming Fast
Over the weekend, Bitcoin price yet again shocked the crypto market and breached the important psychological resistance at $10,000, and soon after tested above $11,000 before a pair of violent rejections below. дальше »
2019-6-25 23:00 | |
|
|

Are Bitcoin Futures predicting the future for Bitcoin’s spot prices?
Bitcoin’s price action is similar to a lot of other bubbles in history. In fact, BTC’s chart and patterns have striking similarities to the DotCom bubble, Qualcomm Charts etc. , which could be due to the fractal nature that is witnessed everywhere in nature and in human behavior. дальше »
2019-6-13 11:30 | |
|
|

Bitcoin (BTC) Fractal Suggests $20,000 Is Around The Corner, But Don’t Count On It
Bitcoin Fractal Suggests Upside Potential Price action that is seen in Bitcoin (BTC) markets seems entirely random, controlled by a select group of “whales” and “institutions” that can seemingly flash crash any digital asset with a few. дальше »
2019-6-3 00:35 | |
|
|

Bitcoin At $20,000 By July: Fractal Suggests BTC Has Room To Run
Fractal Accentuates Bitcoin Won’t Pull Back Yet Price action that is seen in Bitcoin (BTC) markets seems entirely random, controlled by a select group of “whales” and “institutions” that can seemingly flash crash any digital. дальше »
2019-6-1 09:00 | |
|
|

Bitcoin (BTC) Will Correct to $8,000 Should Eerie Fractal Play Out In Full
Bitcoin May Correct to $8,000 Last week, analyst Crypto Kaleo drew attention to an eerie Bitcoin (BTC) fractal. As seen below, the cryptocurrency was following the price action of early-May, but on a different time. дальше »
2019-5-28 02:45 | |
|
|
Inverse Chart Demonstrates Bitcoin Price Following Bear Bottom To Bull Market Fractal
The leading cryptocurrency by market cap has only been around for just over a decade. Due to this, there isn’t much history in Bitcoin price charts to attempt to discover historical repeating patterns that can be used to help determine future movements. дальше »
2019-5-18 04:01 | |
|
|
Inverse Bitcoin Price Chart Fractal Could Hint Where Crypto Market Moves Next
While crypto investors often argue over the merit of technical analysis, there’s no denying that Bitcoin price charts and that of other most popular crypto assets – or any asset type for that matter – show repeating chart patterns that may indicate where a market may move next. дальше »
2019-3-27 23:00 | |
|
|

XRP Price Analysis – XRPUSD Continues Falling
By Dmitriy Gurkovskiy, Chief Analyst at RoboForex The XRP is under pressure Tuesday, trading around $0. 3030. On H4, the price left the triangle by breaking out the support. The downtrend may last for long, with the first target at the fractal support of $0. дальше »
2019-3-27 18:03 | |
|
|
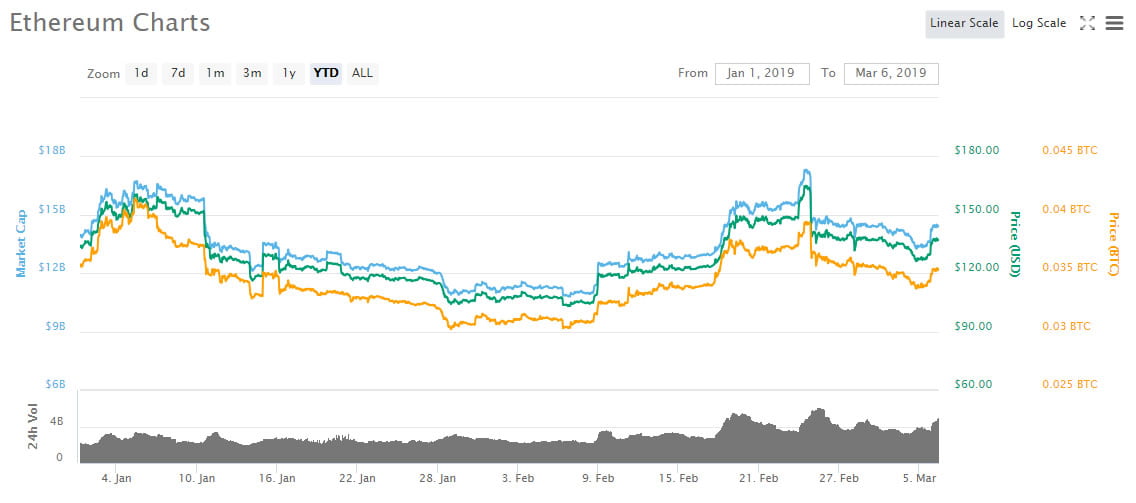
Ethereum Fractals Play Out as ETH Jumps 10%, Where Will it Go Next?
Another rally has initiated on crypto markets and Ethereum has performed particularly well with a pump of 10% over the past few hours. Fractal patterns are often used to make price predictions and those on the Ethereum charts are very clear at the moment. дальше »
2019-3-6 11:30 | |
|
|
Fractal Pattern Analysis Indicates Bitcoin Could Fall to $2,500 Before Recovery
Chart and pattern analysis has been widely used to try to predict when Bitcoin and crypto markets will hit the bottom. A huge range of technical indicators combined with historical snapshots are put to work in order to tell us when the optimum time to get back in is. дальше »
2019-1-24 12:00 | |
|
|
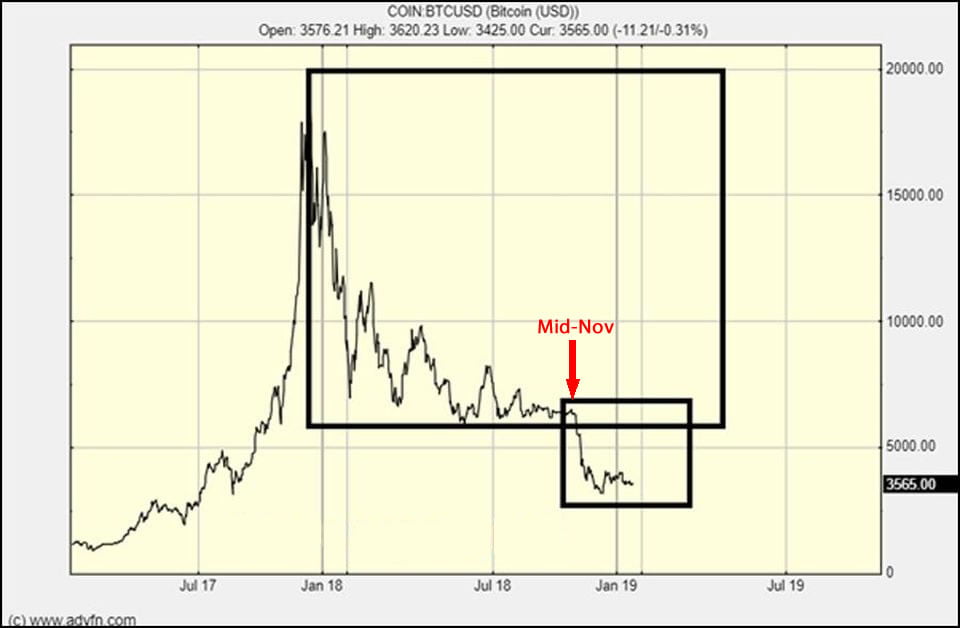
Bitcoin (BTC) Fractal Analysis Shows Bots Still Dominate The Market
Bitcoin (BTC) has fallen sharply in the last 24 hours on news of the SEC delaying its decision regarding the VanEck/SolidX Bitcoin ETF till September. The 4H chart above for BTC/USD shows that while the news served as a catalyst for yesterday’s price action, Bitcoin (BTC) would have eventually followed the same pattern as major trading activity is still dominated by bots. дальше »
2018-8-9 21:30 | |
|
|
12 |