Новости о Close Weekly [ Фото новости ] [ Свежие новости ] | |

Litecoin Price Prediction: Is LTC Going To Make Another High, or Is This the Top?
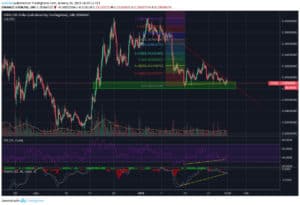
Long-Term Outlook A look at the Weekly chart for Litecoin shows that the price is trading below the minor resistance area near $80. It is trading above the 21 and 200-period moving average but below the 50 and the negative Ichimoku cloud. дальше »
2019-3-21 15:39 | |
|
|
Tron [TRX] Price Prediction: A Breakdown Looks Inevitable
Long-Term Outlook A look at the Weekly chart for TRX shows that the price is trading between the 21 and 50-period moving averages. It has found support above the 21-period MA. It made a bottom near the support area at $0. дальше »
2019-3-19 17:38 | |
|
|

Tron [TRX] & IOTA Price Action – Traders Uncertain As Both Continue to Consolidate
Tron closed last weeks candle as a Doji reflecting the uncertainty from traders regarding the future price prospects of Tron. A Doji candle is a candle where the open and the close are around the same point and typically reflects uncertainty from traders. дальше »
2019-3-18 15:04 | |
|
|
Cardano Price Prediction: Is an ADA Price Increase To Be Expected In The Future?
Long-Term Outlook A look at the Weekly chart or ADA shows that the price has just moved past the 21-period moving average which had been offering close resistance to the price since April 2019. The past four weekly candles have been bullish. дальше »
2019-3-17 15:29 | |
|
|
Ripple’s XRP & Stellar Lumens [XLM] Technical Analysis: XRP Continues Consolidation While XLM Outperforms
XRP continues to consolidate despite most altcoins recording increases in relation to both USD and bitcoin over the past week. XRP looks likely to form yet another Doji candle on the weekly chart for this week of price action. дальше »
2019-3-17 14:44 | |
|
|
XRP Price Prediction: Did XRP Finally Break Out of The Symmetrical Triangle?
Long-Term Outlook A look at the Weekly chart for XRP shows that the price is trading at $0. 32, facing very close resistance from the 21-period Moving Average. It is trading slightly above the $0. дальше »
2019-3-16 19:43 | |
|
|
Bitcoin [BTC] & Dogecoin [DOGE] Technical Analysis – Pivotal Point for Bitcoin as it Returns Above $4000
Bitcoin Technical Analysis Bitcoin is close to closing its fourth gain on the weekly chart. An increase over the past 24 hours has brought the price of bitcoin back above $4000 but the market leader now faces pivotal resistance points. дальше »
2019-3-16 15:01 | |
|
|

Bitcoin Price Analysis: Why BTC Bulls Are Charging at $4000
Bitcoin price broke out overnight and retested the $4k handle for the sixth time since the lows of the middle of December 2018. Let’s take a look at what this might mean going into the rest of the weekend. дальше »
2019-3-16 11:30 | |
|
|
IOTA Price Prediction: The Price Is Nearing a Breakout From the Triangle
Long-Term Outlook A look at the Weekly chart for IOTA shows that the price is trading near $0. 3, facing very close resistance from the 21-period moving average. It is also trading below the 50-period MA and the Ichimoku Cloud. дальше »
2019-3-15 15:14 | |
|
|

Bitcoin Price Analysis: Low Time Frames Show Signs of Life Amid Weekly Tests
Bitcoin continues to coil tightly within its range-bound market as the bulls and bears fight it out to see which is most dominant. On the lower time frames (TF), bitcoin is managing to find support:Figure 1: BTC-USD, 2-Hour Candles, Low TF SupportThe zone outlined by the green line in Figure 1 represents local support that has kept the market afloat for the last week and a half. дальше »
2019-3-13 22:26 | |
|
|
TRON Price Prediction: TRX Is Nearing the End of the Symmetrical Triangle
Long-Term Outlook A look at the Weekly chart for TRX shows that the price is trading between the 21 and 50-period moving averages. It has found support above the 21-period MA. It made a bottom near the support area at $0. дальше »
2019-3-12 16:39 | |
|
|
Ethereum Price Prediction: When Will ETH Break Past the Resistance?
Long-Term Outlook A look at the Weekly logarithmic chart for Ethereum shows that the price is trading below the 50 and 21-period MAs while struggling to break out above the 21-period moving average, which is giving very close resistance to the price. дальше »
2019-3-10 18:38 | |
|
|


Bitcoin Price Analysis – A Grizzly Start to the Week
Bitcoin price closed the week up 1. 5% at $3789, despite the green candle close, the bears have taken control in the early hours of Monday morning, pushing Bitcoin price back into the $3600 range. дальше »
2019-3-4 18:00 | |
|
|
Stellar Price Prediction: XLM Has Bounced on the Support Line, Where Is It Heading Now?
Long-Term Outlook A look at the Weekly chart for XLM in logarithmic form shows that price is trading above the major support area is $0. 06-$0. 07, currently trading at $0. 086. Furthermore, the price is facing very close resistance from the 200-period moving average and trading below the 21 and 50 MAs and the Ichimoku Cloud. дальше »
2019-3-1 14:59 | |
|
|
Bitcoin Price Analysis: Bullish Rejection Wipes Out Bitcoin’s Weekend Gains
Over the weekend, a strong rally was stifled by an even stronger rejection as the bitcoin market was shoved into a band of overhanging resistance. This band of resistance has been mentioned several times in our analyses over the last few weeks as it has proven impossible to overcome for the time being:Figure 1: BTC-USD, Daily Candles, Failed BreakoutThis run to the low $4,000s coincided with a breakout of a rather large symmetrical triangle consolidation shown above. дальше »
2019-2-26 02:42 | |
|
|

Bitcoin Price Analysis – Bulls Blast Through $4K But is a Correction Imminent?
Bitcoin price continued surging through the early hours of Sunday morning, making new highs for 2019, up 1. 9% at $4190. As we head into the weekly close we look at the price action and what may lie ahead. дальше »
2019-2-24 15:00 | |
|
|

Dogecoin Price Prediction: DOGE Has Broken Out of the Downward Channel, Where Is It Heading Next?
Long-Term Outlook A look at the Weekly chart for Dogecoin shows that price is currently trading at $0. 0021, on the edge of the support area formed by previous lows. Furthermore, we can see that price has found support right above the 200-period MA. дальше »
2019-2-24 13:44 | |
|
|
Stellar Price Prediction: Did XLM Finally Make a Bottom at $0.07 and Are We Going to Move Past $0.1?
Long-Term Outlook A look at the Weekly chart for XLM / USD in logarithmic form shows that price is trading above the support area of $0. 06/$0. 07 created by the highs of April 2018. Price has created a small amount of bullish divergence with the RSI. дальше »
2019-2-23 14:19 | |
|
|
XRP Price Prediction: XRP Is Very Close to Breaking Through Resistance, When Will a Successful Attempt Occur?
Long-Term Outlook A look at the Weekly chart for XRP/USD shows that price is currently trading at $0. 33, slightly above the support area near $0. 28. The RSI is at 43, indicating neither overbought nor oversold conditions. дальше »
2019-2-21 12:54 | |
|
|
Ethereum Price Prediction: ETH Breaks Out Above the Daily Ichimoku Cloud, Will It Move Past the 21-week MA?
Long-Term Outlook A look at the Weekly chart for ETH/USD in logarithmic form shows that price has bounced back after finding support in the minor support area near $80. The price is currently slightly below the minor resistance area at $160 and facing very close resistance from the 50-period MA. дальше »
2019-2-20 12:09 | |
|
|
Bitcoin Price Analysis: Consolidation Breaks Out Into Macro Resistance Test
Over the course of the last 10 days, bitcoin has managed to rally nearly 20% in value as it burst through two major resistance levels and is now beginning the test of a major macro level:Figure 1: BTC-USD, Daily Candles, Macro ResistanceWe can see a clear, descending supply-and-demand channel that governed the market for the last two months. дальше »
2019-2-20 01:38 | |
|
|
Bitcoin Price Watch: Chances of Much Larger BTC Bullish Breakout
Bitcoin price surged and broke the $3,720 and $3,880 resistance levels against the US Dollar. The price traded close to the $4,000 resistance level and a new weekly high was formed at $3,955. There is a connecting bullish trend line formed with support at $3,800 on the hourly chart of the BTC/USD pair (data feed. дальше »
2019-2-19 09:30 | |
|
|

Bitcoin Price Analysis: $4000 in Sight After Last Week’s Bullish Move
As Bitcoin price finished the week with a strong move to the upside, we take a look at what this means for the Bulls and Bears heading into the week. Weekly Chart Bitcoin price closed the week at $3,650 (+6. дальше »
2019-2-11 17:00 | |
|
|
Stellar [XLM] Price Prediction: Does the Low Volume Indicate That This Was a False Breakout?
Long-Term Outlook A look at the Weekly chart for Stellar in logarithmic form shows that price is trading at $0. 077, slightly below the 200-Period MA and very close to the major support area formed by the highs of April 2017 at $0. дальше »
2019-2-8 14:59 | |
|
|
Binance Coin [BNB] Price Prediction: Does the Bearish Divergence Mean That We Just Made a Double Top?
Long-Term Outlook A look at the Weekly chart for BNB in logarithmic form shows that price is trading at $7, very close to the 7-period MA and the previous resistance area at $7. 5-$8. 5. The nearest support area can be found at $4. дальше »
2019-2-5 14:39 | |
|
|
Ethereum Price Prediction: Did We Reach the Bottom or Is There Another Drop in Store?
Long-Term Outlook: A look at the Weekly chart for Ethereum in logarithmic form shows that after breaking down through the $180 support, the price is trading at $109, below the 7,21,50 period moving averages and the Ichimoku cloud. дальше »
2019-2-3 16:44 | |
|
|
DOGE, XRP, XLM, TRX: What’s in Store for Price in the Coming Weeks?
XRP Price Analysis: A look at the Weekly chart for XRP shows that price is very close to the $0. 26-$0. 28 support area, currently trading at $0. 30. Price is trading below the 7, 21, 50, 200-period moving averages and the Ichimoku cloud. дальше »
2019-2-3 16:19 | |
|
|
Stellar [XLM] Price Prediction: Approaching the Support Area, When Will the Bull Run Start?
Long-Term Outlook A look at the Weekly chart for XLM in logarithmic form shows that price is trading at $0. 084, very close to the support area at $0. 06-$0. 07. Price is trading below the 7,21,50 period moving averages and the Ichimoku Cloud. дальше »
2019-1-31 17:14 | |
|
|
XRP Price Prediction: Was This the Breakout of the Descending Wedge?
Long-Term Outlook A look at the Weekly chart for XRP in logarithmic form shows that price is very close to the $0. 26-$0. 30 support area, currently trading at $0. 31. Price is trading below the 7,21 period moving averages and the Ichimoku Cloud. дальше »
2019-1-31 15:19 | |
|
|
Litecoin [LTC] Price Prediction: Will the Third Attempt at Breaking Resistance Be Successful?
Long-Term Outlook A look at the Weekly chart for Litecoin in logarithmic form shows that the price is very close to the support area of $25-$30 formed by the highs of 2014, currently trading at $32. дальше »
2019-1-30 17:24 | |
|
|
Bitcoin Price Analysis: Major Support Broken on Expanding Volume and Spread
After weeks of consolidation, bitcoin finally broke through support. The market now finds itself cruising toward prior lows. On expanding volume and spread, the bitcoin market appears ripe for a continuation of the downtrend:Figure 1: BTC-USD, Daily Candles, Broken SupportAlthough the current daily candle has yet to close, unless there is a strong influx of demand hitting the market, it stands to reason that bitcoin will be closing a new daily low for the first time since mid-December. дальше »
2019-1-29 02:01 | |
|
|
Price Predictions for the Top 5 Penny Cryptocurrencies: XRP, XLM, TRX, ADA & IOTA
XRP Price Prediction and Analysis: A look at the Weekly chart for XRP shows that price is very close to the major support area at $0. 30. Price is trading below the 7 and 21 period moving averages. дальше »
2019-1-26 17:09 | |
|
|
Bitcoin price prediction: Possible descending wedge breakout
Long-term outlook: A look at the Weekly chart for Bitcoin shows that price is currently trading at $3640, finding steady support at the 200-period moving average. The RSI was below 30 for a short while, indicating oversold conditions. дальше »
2019-1-24 17:29 | |
|
|

Living on Bitcoin Day 6: An Artist, a Dev and a Moon Boy Walk Into a Bar…
This is the fifth instalment of reporter Colin Harper's "Living on Bitcoin" experience in San Francisco. Find out what happened to him earlier on Day 1 , on Day 2 , on Day 3 , onDay 4 and on Day 5. дальше »
2019-1-23 01:05 | |
|
|
XRP Price Prediction: Approaching the End of the Symmetrical Triangle
Long-Term Outlook A look at the Weekly chart for XRP shows that price is currently trading at $0. 32, close to the long-standing support area at $0. 3. Price is facing very close resistance from the 7-period moving average and is also below the Ichimoku cloud. дальше »
2019-1-22 15:04 | |
|
|
Stellar [XLM] Price Prediction: Price Broke Out of the Descending Wedge, What Is Next?
Long-Term Outlook A look at the Weekly chart for Stellar in logarithmic form shows that price broke the long-standing support line at $0. 2 in mid-November and is now close to the first major support area in $0. дальше »
2019-1-17 20:27 | |
|
|

Dogecoin [DOGE] Price Prediction: After a Month of Retracing, Is a Rally in Store?
A look at the Weekly chart for Dogecoin shows that price fell right back to the 0. 002$ support area formed by previous lows. Furthermore, the price is very close to the 200-period moving average which is also offering support. дальше »
2019-1-16 17:24 | |
|
|
Tron [TRX] Price Prediction & Analysis: Price Is Close to Support, Does It Have Strength for Another Rally?
Long-Term Outlook A look at the Weekly chart for TRX shows that price is following a descending support line and currently trading at $0. 023. Price rallied until $0. 04 where it found resistance corresponding with the 21 period moving average and promptly reversed. дальше »
2019-1-14 16:19 | |
|
|
NEO: Is a Rally Coming, or Is Price Going to Continue the Fall?
A look at the Weekly chart for NEO shows that price fell from the long-standing support area of $18-22 and is now trading at around $7. Price dropped all the way to $5, coming close to the bottom achieved in late October 2017 at $3. дальше »
2018-12-27 13:19 | |
|
|
Cardano (ADA): Price Is Back to Opening Levels, What Will Happen Next?
A look at the weekly chart for ADA shows that price has lost 98% of its value since the January 2018 high and is now trading close to the $0. 03 level. It is worth noting that there was significant buyer volume in the third week of September as evidenced by the higher green bar. дальше »
2018-12-18 17:24 | |
|
|
Ripple [XRP]: Will Support Hold or Are We Heading Downward?
A look at the Weekly chart of Ripple in logarithmic form, shows us that price has fallen from the high of January 2018 of around $3.2 to close to $0.3. There is some support in the $0.3 area, and it is worth noting that there was a bounce with strong volume in September (yellow arrow), […] Ripple [XRP]: Will Support Hold or Are We Heading Downward? was originally found on [blokt] - Blockchain, Bitcoin & Cryptocurrency News. дальше »
2018-12-15 16:19 | |
|
|
Most Cryptos Very Close to the Bottom Says This Week’s Technical Analysis
The weekly Crypto Technical Analysis is provided by Dmitriy Gurkovskiy, Chief Analyst at RoboForex. Needless to say, all statements and views expressed below and any forecasts contained herein are solely based on. дальше »
2018-12-12 19:29 | |
|
|
Bitcoin Price Weekly Analysis: Sell Rallies In BTC/USD Near $5,880
Key Points Bitcoin price declined heavily and traded close to the $5,200 support level against the US Dollar. There is a short term consolidation pattern formed with resistance at $5,550 on the 4-hours chart of the BTC/USD pair (data feed from Kraken). дальше »
2018-11-18 09:30 | |
|
|

Bitcoin Price Analysis: Yearly Support Breaks as Bitcoin Tests Underlying Demand
After months and months of consolidation, the yearly support finally broke and now bitcoin has found itself in the lower $5000s for the first time since 2017:Figure 1: BTC-USD, Daily Candles, Broken SupportBitcoin managed to drop a staggering 16% yesterday as the market sliced through the long held support like a knife through butter. дальше »
2018-11-16 01:28 | |
|
|


Bitcoin Technical Analysis: A Comprehensive Review of The Weekly Chart
The Cryptocurrency market closed on a high last week with all major cryptos finishing the week on a relative high. A reasonably strong close for the first week of November has many analysts once again facing the question if the bottom is in. дальше »
2018-11-6 06:00 | |
|
|