Новости о Chart Could [ Фото новости ] [ Свежие новости ] | |

PI Price Flashes Bullish Pattern — Could It Jump 22%?
The PI price is flashing a falling wedge chart pattern on its 12-hour chart that analysts at Invezz say could push the token 22 percent higher toward the $0.200 resistance level, with smart contract catalysts and a Kraken listing adding… дальше »
2026-4-15 22:35 | |
|
|
Chart Shows How BONK Price Could See Its Next Double-Digit Rally
BONK price is once again stirring curiosity as traders look for signs of its next big move. After weeks of choppy trading, the token has reached a point where the chart suggests something more decisive could be around the corner. дальше »
2025-8-31 01:15 | |
|
|
Could GitHub submissions push Uniswap [UNI] up the price chart
Thanks to Decentralized Finance (DeFi), strangers on the internet are now able to access financial services on decentralized exchanges with no middlemen. With a total of $7b worth of liquidity committThe post Could GitHub submissions push Uniswap [UNI] up the price chart appeared first on AMBCrypto. дальше »
2022-4-28 04:30 | |
|
|
AAVE's bullish morning star candlestick pattern could see this move next
Forming renewed highs above 23.6% Fibonacci resistance, AAVE was under another northbound leg on the daily chart. A close above the 38.2% Fibonacci level would allow the altcoin to propel to a newer hThe post AAVE's bullish morning star candlestick pattern could see this move next appeared first on AMBCrypto. дальше »
2022-4-22 03:30 | |
|
|
RUNE could be due for a heavy retracement thanks to this top reversal setup
RUNE's price has formed a top reversal pattern on the 2-day chart and it further hints at a massive correction. If investors continue to book profit or Bitcoin takes a U-turn, there is a good chance TThe post RUNE could be due for a heavy retracement thanks to this top reversal setup appeared first on AMBCrypto. дальше »
2022-4-6 11:15 | |
|
|
Bitcoin Weighed Down by $48K Resistance; Support at $43K
Bitcoin (BTC) is in pullback mode after a choppy weekend. The cryptocurrency could find support around $43K, which should stabilize the down move. Momentum signals turned negative on the daily chart, similar to what occurred during the first week of February and March. дальше »
2022-4-5 21:17 | |
|
|
Bitcoin Faces Initial Resistance at $46K; Support at $42K
Bitcoin (BTC) relief rally could stall around $46K, although stronger resistance is seen around $51K. Lower support levels could stabilize pullbacks, especially as indicators improve on the weekly price chart. дальше »
2022-3-26 21:32 | |
|
|
CoinMerge – Social Media Redefined
CoinMerge LLC, (CMERGE) is a Technology company based out of TX, USA that exists both on the ERC and BSC blockchain. Founded in 2021 this company began building the first Crypto Social Media Platform where users could come to chat, chart, trade, learn, and so much more all in one place on a single device. дальше »
2022-3-11 13:36 | |
|
|
Bitcoin Extends Pullback Toward $37K-$40K Support Zone
Bitcoin (BTC) continues to decline from key resistance levels, indicating a loss of short-term momentum. Support around $37K-$40K remains intact, which could stabilize the down move. On the weekly chart, conditions are still neutral, benefitting short-term trades. дальше »
2022-3-5 22:12 | |
|
|
BTC Holders Reduce Spending, Why Bitcoin Could Get More Rocket Fuel
Bitcoin trends to the upside in the daily chart after experiencing some downside action during the weekend. As of press time, the benchmark crypto trades at $63,136 with a 3. 8% profit in the 24-hour chart. дальше »
2021-10-26 01:22 | |
|
|
FED’s Powell Confirms Persisting Inflation, Could Tapering Stop Bitcoin’s Rally?
Bitcoin has dropped 3.8% in the 24-hour chart as the Chairman of the U.S. Federal Reserve Jerome Powell gave a speech on the current economic outlook. As of press time, the crypto market has negatively reacted to Powell’s statements as the intuition finally hints at a possible start of tapering. Related Reading | Can “Coin Days […] дальше »
2021-10-23 01:00 | |
|
|
Bitcoin (BTC) Fractal Suggests Rise to $250-350k by 2021
The long-term chart of Bitcoin (BTC) contains a fractal, the repeat of which could take the price to the $250-350k range as late as 2021. A break through the resistance area near $60,000 could initiate a parabolic rise, similar to the end of the 2013 and 2017 markets. дальше »
2021-9-20 19:13 | |
|
|
Why Bitcoin Could Rise To $53K, Here Are The Risks Bulls Must Overcome
Bitcoin is moving sideways in lower timeframes as the crypto markets continue to run without a clear direction. The first cryptocurrency by market cap trades at $47,837 with a 1. 2% loss in the daily chart. дальше »
2021-9-17 22:03 | |
|
|
Quant Explains How Gemini Netflow Can Predict Bitcoin Tops
Quant explains how there may be a correlation between the Gemini Bitcoin netflow and BTC price tops, based on pattern of the last few years. Can Gemini Netflow Predict Bitcoin’s Price Tops? As posted by an analyst on CryptoQuant, the historical chart for the Gemini netflow (30-day MA) vs the price reveals there could be a correlation between the indicator and BTC tops. дальше »
2021-9-15 22:00 | |
|
|
Chart Mirroring: Access To Professional Cryptocurrency Traders’ Charts
CoinPanel has recently launched a revolutionary trading feature that could change the lives of cryptocurrency investors. The post Chart Mirroring: Access To Professional Cryptocurrency Traders’ Charts appeared first on BeInCrypto. дальше »
2021-9-10 09:52 | |
|
|
Solana Breaks $80 Barrier, Why It Could Still Climb 4x From Here
Making its way into the crypto top 10 by market cap, Solana (SOL) has reached a new all-time high briefly hitting over $80 in the past day. At the time of writing, SOL trades at $76,38 with a 15% profit in the daily chart. дальше »
2021-8-19 01:00 | |
|
|
Back To The Futures: Ethereum CME Open Interest, Trading Volume Balloons
Ethereum has been slowing down on its bullish momentum. The second cryptocurrency by market cap trades at $3,066 with a 4. 2% loss in the daily chart. After two weeks of profits and an incredible rally from the low at $2,000, mostly driven by the implementation of EIP-1559, Ethereum could see some downside in the short term. дальше »
2021-8-19 21:00 | |
|
|
Bear Market Over? Why Bitcoin Could Soar To $45K As Strong Holders Grow
Bitcoin has retaken the highs of its current range. The first cryptocurrency by market cap trades at $41,300, at the time of writing, with a 6% and 23. 8% profit in the daily chart. The general sentiment in the market has flipped bullish, the fear and greed index signals greed for the first time in months. дальше »
2021-8-1 01:00 | |
|
|

Bitcoin On Track To $100K, Why The Bull Cycle Could Be Just In Its Early Days
Bitcoin trades north of the $32,000 levels as the bulls regain some conviction in the daily chart. The general sentiment in the market seems more bullish, but many still warn caution until BTC’s price moves higher to a safer zone. дальше »
2021-7-23 21:12 | |
|
|

Big bullish pattern on US dollar index chart puts Bitcoin at risk of losing $30K
A strengthening dollar could be negative for pretty much every risk asset on board, including Bitcoin, whose value boomed against the dwindling greenback after March 2020. дальше »
2021-7-17 20:28 | |
|
|
Why The Next 60 Days In Bitcoin (BTC) Could Be Wild
Bitcoin could retest the lows of its current range as its price trends to the downside. At the time of writing, BTC’s trades at $32,277 with a 2.3% loss in the daily chart. Investors and traders wonder if these levels will hold as bulls seem to lack conviction in lower timeframes. Trader Josh Rager highlighted […] дальше »
2021-7-13 01:00 | |
|
|
Bitcoin Could Fall To $10K, Louis Navellier
Louis Navellier was on CNBC to talk about the current chart movements in Bitcoin. Talking about the price movements, Navellier said he believed that the price could very well fall below $10k. According to Louis Navellier, the pandemic is taking us back to where we were before it all started. Pointing out that the price […] дальше »
2021-6-28 20:30 | |
|
|

Institutions Cautious of Buying Bitcoin (BTC) at Current Price Levels, Says JPMorgan
There could be more room for bitcoin’s (BTC) price to slide further down, JPMorgan opines. Bearish Mid-term Scenario for Bitcoin Bitcoin continues to slide down the price chart amid a wider market sell-off, and if Wall Street giant JPMorgan’s words are anything to go by, there could be more pain ahead for BTC holders. AccordingRead More дальше »
2021-6-27 21:00 | |
|
|

XRP Bulls Watch Out — Trading Veteran Identifies Pattern That Could Drive Price To All-Time Lows
One of the most seasoned technical analysts and chartists in the industry has delivered a dire warning about XRP, and it doesn’t bode well for the asset’s price. Peter Brandt has spotted an infamous chart pattern that he estimates could send the XRP price to all-time lows if it’s completed. XRP Is Teetering On The […] дальше »
2021-6-25 21:43 | |
|
|

Classic bearish chart pattern forms for Bitcoin as BTC price tumbles to $32K
Bitcoin flashes a classic bearish technical pattern that could crash BTC prices to below $20,000.
дальше »2021-6-22 15:12 | |
|
|

Bearish or Bullish? Bitcoin Traders Argue Over Death Cross Outcome
On Saturday, cryptocurrency analysts and traders have been discussing bitcoin’s recent chart patterns and the infamous death cross pattern has been a topical conversation. A number of traders believe when bitcoin’s short-term moving average (MA) dips below the long-term MA, the crypto asset could be bracing for a major sell-off. Meanwhile, others are sure the […] дальше »
2021-6-21 18:00 | |
|
|
Why Paul Tudor Jones Could Invest 5% Of Its Portfolio In Bitcoin
Bitcoin comes out of the weekend with a pump into the $40,000 resistance area. At the time of writing, the first cryptocurrency by market cap trades at $40,540 with a 13. 5% profit in the daily chart. дальше »
2021-6-14 19:14 | |
|
|

Is the worst finally over for Bitcoin?
Market perspective is vital while analyzing the trend of an asset. Consider this - Observing Bitcoin's 1-hour chart at the moment could completely demoralize potential investors. However, the 1-day orThe post Is the worst finally over for Bitcoin? appeared first on AMBCrypto. дальше »
2021-5-29 18:00 | |
|
|
How Leveraged Positions Could Have Accelerated Ethereum’s Slump
Ethereum has retraced to levels not seen since the beginning of 2021. The cryptocurrency records a 50% correction in the weekly chart and has fallen from an all-time high at around $4,000. At the time of writing, ETH trades at 1,927 with 22. дальше »
2021-5-24 22:59 | |
|
|
This Is Why Bitcoin Could Be At Its Best Moment
Bitcoin is lagging behind Ethereum during this bull-cycle. The first cryptocurrency by market cap has been outperformed in the higher timeframes with an 18. 2% profit and 2. 1% loss in the weekly and monthly chart respectively. дальше »
2021-5-3 19:49 | |
|
|
Why Ethereum’s Unstoppable Rally Could Cool Off at $3K
Ethereum has seen a 34. 5% rally during the week. At the time of writing, ETH trades at $2. 976 with a 1. 8% profit in the daily chart. The cryptocurrency has been reaching a new high in the lower timeframes and seems poised to break a major milestone at $3. дальше »
2021-5-3 02:02 | |
|
|

OlympusDAO Fundamentals Explode, How OHM Holders Will Benefit
In only three weeks OlympusDAO native token OHM has gone from $812 to $1639, at the time of writing. In the 30-day chart, the token has a 74.2% profit and a 55% profit in the 7-day chart. The protocol’s fundamental continues growing at an impressive pace and could yield further gains. Data shared by the […] дальше »
2021-4-30 22:30 | |
|
|
Bitcoin Formes “Black Thursday” Buy Signal, Why It Could Lead To $100K
Bitcoin has returned to the previous week’s levels. At the time of writing, BTC trades at $54. 882,07 with a 1. 9% profit in the daily chart. In the weekly and monthly chart, BTC shows sideways movement. дальше »
2021-4-27 18:23 | |
|
|
Swipe (SXP) Attempts to Reclaim Previous Range High Level
If Swipe manages to reclaim this level, it would be an extremely bullish development that could likely lead to a new all-time high in the process. Swipe trading range Cryptocurrency trader @PostyXBT outlined an SXP chart, stating that if the resistance area of the current range is reclaimed, a significant upward movement could follow. дальше »
2021-4-27 15:00 | |
|
|
After The Crash: Why Bitcoin Could Have More Upside Potential
Bitcoin is holding well above the critical support at $47,000. Trading at $50. 067 with 1. 6% in the 1-hour chart and sideways movement in the 24-hour chart, BTC seems to be on a path to recovery on the lower timeframes. дальше »
2021-4-25 22:00 | |
|
|
VeChain Mentioned in 2021 Forbes Blockchain 50, Parabolic Move In Sight?
Up 150. 3% over the past 14 days, VeChain (VET) trades at $0,23 with 15. 6% and 84. 4% profits in the daily and weekly chart, respectively. In addition to the rally, the company celebrated a major milestone that could give a new impulse to its corporate adoption. дальше »
2021-4-18 00:02 | |
|
|

How Litecoin Can Follow DOGE To The Moon And Reach $2,000
With a 181. 5% increase in the 24-hour chart, Dogecoin (DOGE) is breaking every resistance towards a new all-time high. On the other hand, Litecoin is showing strong momentum and, according to a trader, it could follow DOGE’s performance. дальше »
2021-4-17 22:00 | |
|
|
This Is What Gensler’s Confirmation Could Mean For XRP
After an impressive rally in the past days, XRP is currently moving sideways trading at $1,76 with 2. 7% losses in the 24-hour chart. However, the confirmation of Gary Gensler as the Securities and Exchange Commission (SEC) Chairman by the U. дальше »
2021-4-15 23:00 | |
|
|
The Bearish Bitcoin Chart Bulls Definitely Don’t Want To See
Bitcoin price today set a new all-time high, and tomorrow Coinbase goes public putting an even bigger spotlight on the already buzzing cryptocurrency industry. Things couldn’t possibly look more bullish for Bitcoin and the rest of the market, but the recent price action could resemble one market wizard’s schematic of what “distribution” should look like. […] дальше »
2021-4-14 04:00 | |
|
|
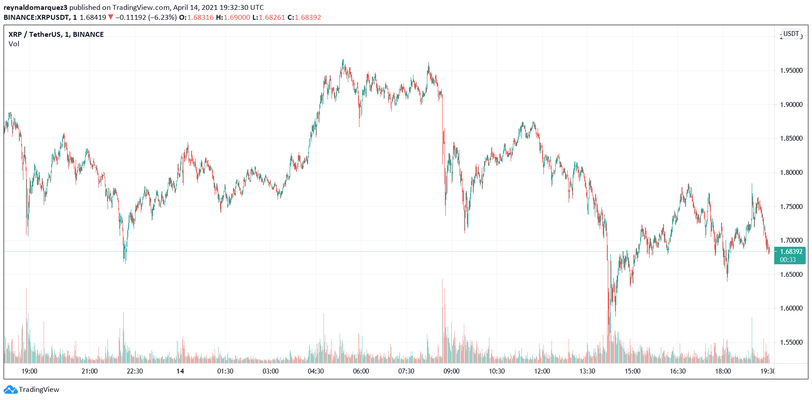
XRP Above $2? Why DeFi Integration Could Be Game Changer
With the biggest gains in the crypto top 10 by market cap, XRP trades at $1.88 recording a 35.9% rally over the past day. In the weekly and monthly chart, XRP is up 107% and 307% respectively. Operator Altstreet Bets has shared the chart below to indicate XRP’s price could go to $3 “without resistance”. […] дальше »
2021-4-14 23:03 | |
|
|
Why Bitcoin below $60K could be a great buying opportunity
Bitcoin seems to be losing steam as it trades back and forth between $59,000 and $60,000. In the daily chart, BTC is moving sideways (0. 3%) after a week with modest gains of 4. 9%. Trader Josh Rager has set support for BTC at $59,000. дальше »
2021-4-12 00:07 | |
|
|
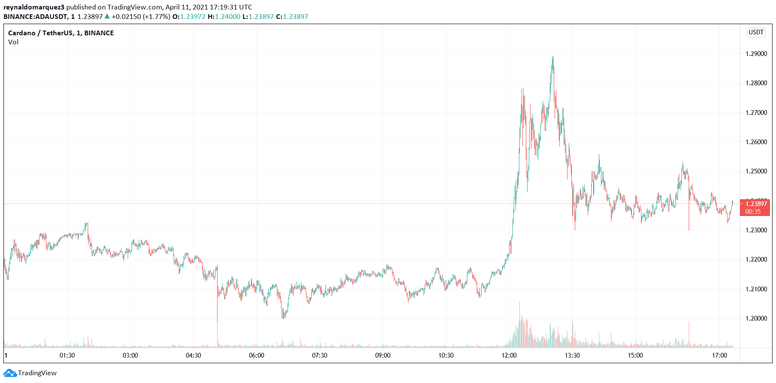
Why ADA could run hotter than Bitcoin and make 10x gains
After breaking in the crypto top 10 by market cap and with 3. 597% gains over the past year, Cardano (ADA) seems to be laying low. At the time of writing, ADA trades at $1,24 with 1. 7% profits in the daily chart and 6. дальше »
2021-4-12 22:00 | |
|
|