Новости о Chart Below [ Фото новости ] [ Свежие новости ] | |

Litecoin Rejected At $55, Bears Might Drag LTC Below Immediate Support Line
Litecoin attempted to rise on its chart, however, the bears were still strong on the chart. Although the coin showed some recovery, technical outlook pointed towards further decline. Bitcoin too has lost steam as the coin plunged below the $20,000 mark. дальше »
2022-7-14 04:00 | |
|
|

Solana Falls Below $35.60, Where Is The Coin Headed Next?
Solana over the last 24 hours registered a loss of 7% and fell below the $35. 50 price mark. The bears have mauled the cryptocurrency market and overall altcoins have fallen on their charts. Solana also is under the bearish price action despite registering minor gains on the hourly chart. дальше »
2022-6-23 07:00 | |
|
|
Ether Drops Below $1K, Dragged Down By BTC Slide – What’s The Next ETH Support?
The cryptocurrency market is still stunned by last week’s precipitous decline. In 10 days, Ether shed around 45 percent of its value. On the four-day chart, the Ethereum (ETH) price has now returned to the historical RSI low recorded in 2018 when the cryptocurrency traded at $81. дальше »
2022-6-18 16:25 | |
|
|
What Does The Bull Div On Ethereum RSI Mean For The Top Altcoin?
Just like other altcoins, Ethereum too extended losses today. Over the last 24 hours, the altcoin slipped below the $1900 price level. Bitcoin also fell on its chart and major industry altcoins followed suit. дальше »
2022-6-8 07:00 | |
|
|
Will Ethereum's low gas fees help ETH go up the price chart
Ethereum, the largest altcoin seems to have done the overdue homework regarding its fee structure. Ethereum network fees plummeted in May, below $10 per transaction. Likewise, cheaper fees on layer oThe post Will Ethereum's low gas fees help ETH go up the price chart appeared first on AMBCrypto. дальше »
2022-5-26 03:30 | |
|
|
Here's how MANA's price could respond to the current market sentiment
After the sellers provoked a high volatility break below the $1.9-level in late April, Decentraland (MANA) saw a series of consistent troughs alongside lower peaks on its chart. The three-week trendliThe post Here's how MANA's price could respond to the current market sentiment appeared first on AMBCrypto. дальше »
2022-5-16 18:00 | |
|
|
Bitcoin sinks below $32K – time to accumulate or jump ship?
The Bitcoin Rainbow Chart dips into the ‘Accumulate’ zone following a miserable run of six consecutive weekly red candles. The post Bitcoin sinks below $32K – time to accumulate or jump ship? appeared first on CryptoSlate. дальше »
2022-5-10 13:25 | |
|
|
Here's what technicals indicate about LUNA's decline phase
Terra (LUNA) was in a flimsy situation on its daily chart. Trading near its 20 EMA (red) 50-SMA (cyan), the altcoin wobbled below its Point of Control (POC, red). Now, bulls needed to save LUNA at The post Here's what technicals indicate about LUNA's decline phase appeared first on AMBCrypto. дальше »
2022-4-26 02:30 | |
|
|
Cardano: A close below this mark would bolster a further pullback
Cardano (ADA) has been on a near-term downtrend after recently breaking down from the ascending channel on its 4-hour chart. Meanwhile, it found a base at its vital $1.02-support. If the 20 EMA (reThe post Cardano: A close below this mark would bolster a further pullback appeared first on AMBCrypto. дальше »
2022-4-11 21:30 | |
|
|

Solana risks 35% price crash with SOL price chart 'megaphone' pattern
Solana market grapples with multiple bearish setups if it breaks below its key 50-week moving average.
дальше »2022-4-10 17:26 | |
|
|

BTC price struggles below $39K ahead of expected interest rate hike by the Fed
Bitcoin consolidates below $39,000 as one trader warns about a possible squeeze on the daily chart, while a nine-year support level continues to hold strong. дальше »
2022-3-15 00:00 | |
|
|
This is when the XRP will reach crucial $1 mark
XRP steeply reversed in a down-channel (white) on its daily chart after poking its nine-month resistance at the $1.3-mark. With this fall, it fell below its EMA ribbons while flipping the 200 EMA (cyaThe post This is when the XRP will reach crucial $1 mark appeared first on AMBCrypto. дальше »
2022-2-14 02:00 | |
|
|
Binance Coin, Avalanche, EOS Price Analysis: 27 January
The last 24 hours have yet again damaged the global crypto market cap. Consequently, Binance coin, Avalanche and EOS flashed bearish flag tendencies on their 4-hour chart. Binance coin fell below its The post Binance Coin, Avalanche, EOS Price Analysis: 27 January appeared first on AMBCrypto. дальше »
2022-1-27 14:30 | |
|
|
With AVAX unable to flip $92 to support, where can bulls make a stand
Disclaimer: These findings are the sole opinions of the writer and should not be considered investment advice On the daily chart, Avalanche hit a new set of lows after it broke down below the prevThe post With AVAX unable to flip $92 to support, where can bulls make a stand appeared first on AMBCrypto. дальше »
2022-1-26 22:30 | |
|
|

Can Ethereum pull off a 40% hike by the end of September
Uptrend, consolidation, deviation, consolidation - This is typically how Ethereum's price chart looked like at the time of writing. The largest alt's price has remained well below $3500 for six straigThe post Can Ethereum pull off a 40% hike by the end of September appeared first on AMBCrypto. дальше »
2021-9-13 22:00 | |
|
|

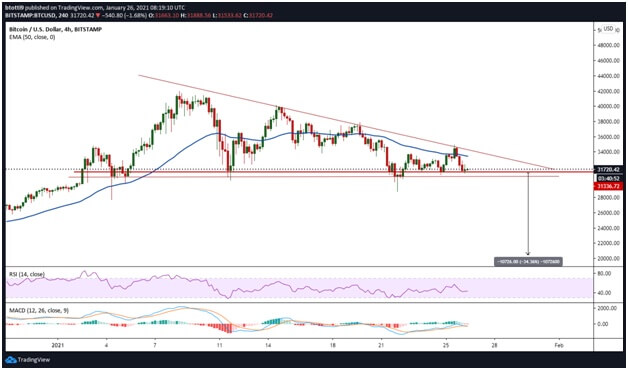
Billionaire Fund Manager Jeffrey Gundlach Convinced Bitcoin Will Fall Below $23K, US Dollar Is ‘Doomed’
Doubleline Capital CEO Jeffrey Gundlach, also known as the “Bond King,” has predicted that the price of bitcoin will fall below the $23K level. “Right now, the chart on bitcoin looks pretty scary,” he said, adding that “it looks like a massive head-and-shoulders top. дальше »
2021-7-18 04:30 | |
|
|
Bitcoin Could Fall To $10K, Louis Navellier
Louis Navellier was on CNBC to talk about the current chart movements in Bitcoin. Talking about the price movements, Navellier said he believed that the price could very well fall below $10k. According to Louis Navellier, the pandemic is taking us back to where we were before it all started. Pointing out that the price […] дальше »
2021-6-28 20:30 | |
|
|

Classic bearish chart pattern forms for Bitcoin as BTC price tumbles to $32K
Bitcoin flashes a classic bearish technical pattern that could crash BTC prices to below $20,000.
дальше »2021-6-22 15:12 | |
|
|

Bearish or Bullish? Bitcoin Traders Argue Over Death Cross Outcome
On Saturday, cryptocurrency analysts and traders have been discussing bitcoin’s recent chart patterns and the infamous death cross pattern has been a topical conversation. A number of traders believe when bitcoin’s short-term moving average (MA) dips below the long-term MA, the crypto asset could be bracing for a major sell-off. Meanwhile, others are sure the […] дальше »
2021-6-21 18:00 | |
|
|
How Bitcoin “Black Thursday” Compares To This Weekend’s Flash Crash
Bitcoin is barely recovering from a bloody weekend. Trading at $56,767 with 2.8% profit in the daily chart and a 5.6% loss in the weekly chart, BTC’s price outlook might seem bearish. However, investor Nik Yaremchuck shared a fractal comparing Bitcoin’s worse period in 2020 and the weekend’s flash crash. As can be seen below, […] дальше »
2021-4-20 17:38 | |
|
|
Why this is an ideal time to buy Binance Coin
Binance coin's price chart shows that a trend has emerged and the altcoin may be consolidating. The price has dropped to the $485 level and below the $500 level, Binance coin is undervalued based on tThe post Why this is an ideal time to buy Binance Coin appeared first on AMBCrypto. дальше »
2021-4-19 21:00 | |
|
|
XRP Above $2? Why DeFi Integration Could Be Game Changer
With the biggest gains in the crypto top 10 by market cap, XRP trades at $1.88 recording a 35.9% rally over the past day. In the weekly and monthly chart, XRP is up 107% and 307% respectively. Operator Altstreet Bets has shared the chart below to indicate XRP’s price could go to $3 “without resistance”. […] дальше »
2021-4-14 23:03 | |
|
|
Why Bitcoin below $60K could be a great buying opportunity
Bitcoin seems to be losing steam as it trades back and forth between $59,000 and $60,000. In the daily chart, BTC is moving sideways (0. 3%) after a week with modest gains of 4. 9%. Trader Josh Rager has set support for BTC at $59,000. дальше »
2021-4-12 00:07 | |
|
|
Gold, Stocks, and BTC: Weekly Overview — March 11
Bitcoin (BTC) As seen in the chart below, BTC had an overall bullish week. Since the beginning of the month, BTC has been recovering from the tumble it took at the end of February. Over the course of last week, it rose from a recent low of around $43,000. дальше »
2021-3-12 22:06 | |
|
|
Bitcoin HODLing Holds During Dip, Says Glassnode
Glassnode published a chart showing the Bitcoin 60-day Spent Output Profit Ratio (SOPR). The chart shows that despite the Bitcoin dip in February, the SOPR did not fall below 1. This indicates that those who bought Bitcoin in 2021 held onto it despite the correction. дальше »
2021-3-6 13:11 | |
|
|

Tether (USDT) Records Highest On-Chain Volume of Over $232 Billion in February
While the wider cryptocurrency market continues to correct, the total on-chain stablecoin volume reached a new high in February. Stablecoin Use Continues to Surge According to a report by The Block, the adjusted monthly on-chain stablecoin volume hit a new high of over $360 billion in February. дальше »
2021-3-1 15:00 | |
|
|
OMG Network (OMG) Approaches Long-Term Resistance at $6.50
Due to OMG Network reclaiming the minor resistance area and the bullishness from technical indicators, it’s likely that the breakout will be successful. OMG Network Long-Term Levels The weekly chart shows that OMG is trading just below the long-term $6. дальше »
2021-2-10 16:30 | |
|
|
NEO Bounces Above Support, Could Make Another Breakout Attempt
Despite this, the NEO/BTC chart remains in bearish price discovery, giving no bullish reversal signs. Long-Term Resistance NEO has been trading below the $23 resistance area since it initially broke down in Oct 2018. дальше »
2021-1-6 17:40 | |
|
|
Monero (XMR) Craters 15% Amid Delisting From Leading Exchange
Monero (XMR) is the worst-performing crypto asset of the past 24 hours. The privacy-focused coin is down 15% in the past day, pushing below key support levels amid a strong drop level. Chart of XMR's price action over the past week from TradingView. дальше »
2021-1-2 04:00 | |
|
|
XRP Loses Long-Term Support after Significant Drop
Until XRP reclaims this level, the long-term trend is considered bearish. Long-Term XRP Levels The weekly chart shows that XRP has decreased to reach a close below the $0. 32 area. This is a level that had been acting as support since it initially broke out in November. дальше »
2020-12-29 16:10 | |
|
|
Bitcoin Almost Taps $28,000 in Continued Holiday Rally
Bitcoin has continued to erupt higher, even as certain traders have asserted that the market is clearly overbought. As can be seen in the chart below, BTC recently moved toward $28,000. While it did not manage to tap that level, it peaked at $27,900 on top exchanges. дальше »
2020-12-27 12:30 | |
|
|
Litecoin (LTC) Finally Breaks Out Above Long-Term Resistance
Both the LTC/USD and LTC/BTC pairs should continue moving upwards towards the targets given below. Breakout From Long-Term Resistance The weekly chart shows that LTC has finally moved above the $85 resistance area, something it has struggled to do since July 2019. дальше »
2020-12-18 16:01 | |
|
|
Blockstack (STX) Sets Sights on New All-Time High
Blockstack (STX) is expected to resume its upward movement towards the resistance targets which we will outline below. Blockstack (STX) Flips Resistance to Support The weekly chart for STX shows that while it has been increasing since March, it has struggled to break out above the $0. дальше »
2020-12-18 15:29 | |
|
|
Bitcoin Wave Count Anticipates Breakout Above Range Highs
However, Bitcoin could first undergo a slight short-term correction before breaking out. Bitcoin Extension Targets $26,000 The daily chart suggests that BTC began a bullish impulse (shown in white below) after the March 13 low and is currently in an extended third cycle wave. дальше »
2020-12-15 15:38 | |
|
|
BCH Struggles to Regain Footing After Considerable Decline
Long-Term Movement The weekly chart for BCH shows that the 0. 5 Fib retracement level rejected the price twice (shown with the red arrows below) at $316. While BCH has moved above this level, notably reaching a high of $363, it has failed to close above it, creating a long upper wick instead. дальше »
2020-12-1 18:34 | |
|
|
Bitcoin: Why the market needs a little more time below $18K
Retracements in Bitcoin's price chart does not both proponents anymore. For the past 6 weeks, BTC has favorably moved above each resistance and now it is faced with another hurdle at $18.5. While BitcThe post Bitcoin: Why the market needs a little more time below $18K appeared first on AMBCrypto. дальше »
2020-11-20 19:30 | |
|
|
Ethereum Drops Below Crucial Technical Pattern and Must Hold $430
Ethereum could undergo a stronger drop in the days ahead, analysts say, as the cryptocurrency slides below key support levels. Ethereum Loses Key Support Level on a Short-Term Basis: Analysis A crypto-asset analyst shared the chart below just recently, showing how the coin has moved below a rising wedge pattern. дальше »
2020-11-16 02:18 | |
|
|
This Crucial Indicator Suggests Bitcoin Is on the Verge of Hitting a Top
Bitcoin has undergone a strong 25% rally over the past two weeks. The coin currently trades for $13,700. Analysts think that the cryptocurrency may undergo a retracement in the near term. Cole Garner shared the chart below recently. дальше »
2020-11-1 07:32 | |
|
|
Chainlink, Tezos, Dogecoin Price Analysis: 30 October
Displaying a bearish scenario Chainlink was seen diving below its short- term period moving averages, on its trading chart. Tezos (XTZ) too continued to remain bearish, with a hint of weakening selliThe post Chainlink, Tezos, Dogecoin Price Analysis: 30 October appeared first on AMBCrypto. дальше »
2020-10-30 19:00 | |
|
|
Ethereum Prints Pivotal Bullish Signal as It Holds $390 Region
Ethereum is expected to move much higher in the months ahead as the leading cryptocurrency prints a bullish technical signal. Ethereum Bounces Cleanly Off $390 Horizontal Region in Bullish Move As the chart shared below shows, ETH recently bounced off the $380-390 horizontal region, which marks a win for bulls. дальше »
2020-10-27 03:00 | |
|
|

More Pain for Bitcoin Ahead as Price Breaks “Legacy Trendline,” Says Analyst
Bitcoin (BTC) is at risk of extending its ongoing downside correction as it breaks below a so-called “legacy trendline. ” As spotted by an independent, pseudonymous chart analyst, the said trendline was acting as a support to Bitcoin since March 2020. дальше »
2020-10-15 10:58 | |
|
|
Troubles for Bitcoin Grow as Analyst Spots “Potential Death Cross”
Bitcoin is on the verge of painting a Death Cross. The technical chart pattern–which forms after an asset’s short-term moving average closes below its long-term moving average–holds credibility for predicting bearish markets. дальше »
2020-10-7 11:01 | |
|
|
Top Bitcoin analyst flips bullish after predicting the 20% retracement last week
Since peaking at local highs of $12,075 last week, Bitcoin has experienced a strong drawdown as depicted in the chart below. The post Top Bitcoin analyst flips bullish after predicting the 20% retracement last week appeared first on CryptoSlate. дальше »
2020-9-8 17:00 | |
|
|