Новости о Candle Close [ Фото новости ] [ Свежие новости ] | |

CME Bitcoin Futures COT report implies 28-41% surge in April
Bitcoin's worst sell-off seems to be a thing of the past, in light of the new weekly candle which is up by 18.83%. With hours remaining for this weekly close, the future of Bitcoin, at least in the shThe post CME Bitcoin Futures COT report implies 28-41% surge in April appeared first on AMBCrypto. дальше »
2020-3-22 12:30 | |
|
|
Bitcoin miners could cry capitulation yet again with price eyeing $7,600 level
The past week was brutal for Bitcoin, with the weekly candle coming to a close today. The weekly chart looked bearish with the current weekly candle engulfing 3 candles before it. As the price hoveredThe post Bitcoin miners could cry capitulation yet again with price eyeing $7,600 level appeared first on AMBCrypto. дальше »
2020-3-1 17:00 | |
|
|

Why Analysts Expect More Upside After Bitcoin Just Broke $10,000 (Again)
Over the past 36 hours, Bitcoin has finally started to show signs of strength after the brutal 10% sell-off earlier this week. From the week’s most traded price at $9,600, the cryptocurrency has pressed higher to $10,000 as of the time of writing this, seemingly to establish a short-term candle close above this crucial psychological level. дальше »
2020-2-24 03:37 | |
|
|
Bitcoin Weekly Candle Close Signals That Rally Is Real
The visit to five figures over the weekend was largely expected for Bitcoin. A higher weekly candle though strengthens the notion that the rally is real and more gains are to be expected. Tapping a New 2020 High Bitcoin earlier hit a new high for 2020 when it tapped $10,200. дальше »
2020-2-10 22:28 | |
|
|
Rally Over? Latest Bitcoin Price Action Resembles Aggressive Distribution Model
Last night, following a bullish weekly close and an even more bullish monthly candle close just days prior, the recent rally in Bitcoin price may have finally topped out. According to the Wyckoff method, the recent price action closely matches an aggressive redistribution model that suggests a severe mark down phase could follow. дальше »
2020-2-4 03:01 | |
|
|
Why Tomorrow’s Monthly Close In Bitcoin Could Be Its Most Critical Yet
In financial markets, high timeframes are the most important when it comes to technical analysis and influence on the overall trend. The same is true for Bitcoin, and all eyes are on tomorrow’s January monthly candle close. дальше »
2020-1-31 22:00 | |
|
|
Bitcoin just cracked $8,500, and it means bulls are taking control
Over the past few hours, Bitcoin has exploded higher. Since the close of Monday’s daily candle at 23:59 yesterday, the cryptocurrency has gained 6 percent, surging as high as $8,580 from $8,100 as buyers stepped in en-masse. дальше »
2020-1-14 13:34 | |
|
|
Lucky Number 7? Bitcoin Closes Six Consecutive Weeks Below $7,500
While much of the world may have been tuned into the 77th Golden Globes awards to see who took home the award for Best Motion Picture, Bitcoin investors couldn’t take their eyes off the weekly candle close last night. дальше »
2020-1-6 22:00 | |
|
|
Bitcoin Price Yearly Candle Shows Failed Rally, Longest Wick on Record
Today’s mid-week daily close in Bitcoin price charts carries significantly more weight than usual, as New Year’s Eve marks the last day of the calendar year, and the crypto asset’s yearly candle close. дальше »
2020-1-1 19:00 | |
|
|
Bitcoin Closes Highest Weekly Candle in Over a Year
The weekend has been largely bearish for bitcoin price as it dumped 6% after a long period of consolidation. The move dropped BTC back to support, keeping it range-bound, but the weekly candle close has been the best since early 2018. дальше »
2019-8-12 13:00 | |
|
|

Bitcoin Hits Highest Weekly Close Since January 2018, Showing Strong Momentum
After spending the best part of the past week consolidating, Bitcoin took a turn south over the weekend. On the bright side, the king of crypto registered its highest weekly close for over a year. дальше »
2019-8-12 13:00 | |
|
|
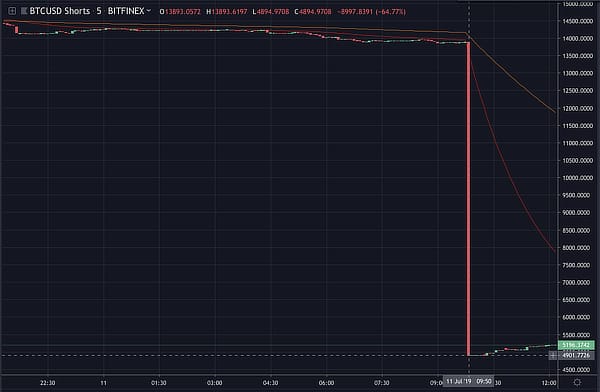
10,000 Bitcoin Shorts Close in Minutes on Bitfinex, Unscheduled Maintenance Announced
An incredible $117 million worth of bitcoin shorts closed on Bitfinex, giving a very uncharacteristic massive red candle. Just what happened here is very unclear, with bitcoin shorts somewhat instantly. дальше »
2019-7-11 17:50 | |
|
|

Bearish Weekly Close Could Create More ‘Buy Bitcoin’ Opportunities
Bitcoin and crypto markets have been mostly sideways over the weekend. There has been little movement in either direction for BTC and most of the high cap altcoins and all eyes have been on the close of the weekly candle. дальше »
2019-7-8 08:54 | |
|
|
Research Shows That Holidays Cause FOMO Fireworks in Bitcoin Price Charts
Yesterday, on the United States holiday dubbed Independence Day, the price of Bitcoin fell from $12,000 to just over $11,000 from daily candle open to close, providing fireworks for traders who spent the day in front of price charts instead of being poolside at a barbecue sipping on a cold Budweiser. дальше »
2019-7-6 23:00 | |
|
|
Bitcoin Price Correction Deepens; Weekly Close Looks Bearish
The Bitcoin price pullback which began at the end of last week has accelerated this Monday morning despite a relatively stable weekend. The weekly candle has closed off with a bearish signal indicating further losses could be coming. дальше »
2019-7-2 06:32 | |
|
|
Bitcoin Price Analysis: BTC/USD Price May Break Out at $8,009 Level
Coinspeaker Bitcoin Price Analysis: BTC/USD Price May Break Out at $8,009 LevelShould the Bullish candle penetrate the resistance level of $8,009 and close above it, Bitcoin price may move up towards $8,235. дальше »
2019-6-12 13:17 | |
|
|
Bitcoin Resistance Turns Support at $8,000 as H&S Pattern Forming
Following the close of a big red candle on the weekly chart, many expected the pullback to accelerate and Bitcoin price to fall even further today. Such is the nature of crypto markets that BTC did the opposite and moved back up above $8,000 once again. дальше »
2019-6-11 08:30 | |
|
|

Analysts Wary After Bitcoin (BTC) Almost Loses Multi-Week Winning Streak
Bitcoin Almost Slips During Weekly Close You may not have realized it, but Bitcoin (BTC) just closed its weekly candle. Despite the fact that BTC tapped $9,100 this week, the cryptocurrency closes this week’s candle. дальше »
2019-6-3 09:00 | |
|
|
Bitcoin Price Close Above $9K Will Be Largest Green Monthly Candle Since 2013
The price of Bitcoin has been on a wild ride in recent weeks, with a parabolic rally that began in early April taking the first-ever crypto asset on a journey back toward its all time high price of $20,000. дальше »
2019-5-31 21:24 | |
|
|
TRON and IOTA Recorded Significant Increases Last Week, but Both Are Down 4.5% Today [Price Analysis]
TRON Price Analysis Last week was an extremely volatile week for most top cryptocurrencies. Tron recorded a low of $0. 021 and a high of $0. 0338 during the weeks trading. The price closed the weekly candle with a strong performance increasing 23% from open to close. дальше »
2019-5-20 11:39 | |
|
|
Volatile Price Movements for IOTA and TRON, but Both Underperform Bitcoin [Price Analysis]
Last week was a volatile week of trading for Tron, but the weekly candle ultimately ended up forming a second consecutive Doji candle. Several Doji candles have formed over the past few months of price action reflecting high levels of uncertainty from traders. дальше »
2019-5-13 15:59 | |
|
|
Crypto Analyst: Bitcoin May Monthly Candle Close Confirms Bull Market or Accumulation
As Bitcoin price nears closer to important resistance at $6,000, it’s clear that the leading cryptocurrency by market cap is at an inflection point, and where it goes next could set the tone for the following months to years. дальше »
2019-5-8 23:00 | |
|
|
TRON Holds Support While IOTA Starts the Week With a Downturn [Price Analysis]
The last weekly candle for Tron closed as a Doji candle after three consecutive weeks of declines. The price of Tron managed to close above support at $0. 0238 despite dropping below in intra-week trading for the past two weeks. дальше »
2019-5-6 12:27 | |
|
|

Bitcoin Price Analysis: Short Squeeze Imminent as Bearish Pressure Weakens
Summary:Following unconfirmed claims by the NYC Attorney General regarding Bitfinex and Tether’s insolvency, the bitcoin market had a knee jerk reaction that caused us to retest macro support. дальше »
2019-5-1 01:32 | |
|
|
Bearish Price Prospects for XRP and Stellar Lumens After Consecutive Losses [Price Analysis]
Despite buying pressure earlier in the month, XRP is forming another Doji candle on its monthly chart as April approaches its close. If the monthly candle closes as a Doji, this will mark the fifth consecutive Doji candle recorded on the monthly chart. дальше »
2019-4-28 11:19 | |
|
|
Sell in May and Go Away? A Look At Historic Bitcoin Price Performance in May
The first ever cryptocurrency, Bitcoin, is set to close its third consecutive monthly candle as green, after a record-setting six candles closed in red, taking Bitcoin price to its current bear market low of $3,150. дальше »
2019-4-25 23:01 | |
|
|

Bitcoin (BTC) Price Looks Primed For New 2019 Highs
Bitcoin price completed its fifteenth week of 2019 overnight and once again the bulls managed to print a higher high on the candle close we take a look at what this means going in to the week ahead. дальше »
2019-4-22 15:00 | |
|
|
Key Bitcoin Metric Flashes Bullish for First Time in 442 Days
The bitcoin price just accomplished something it failed to do every day for more than a year, and it has speculators foaming at the mouth. For the first time in 442 days, in nearly 15 months, a positive candle of bitcoin was closed on a chart that uses a technical analysis method called the Ichimoku Cloud, a collection of indicators that demonstrate support and resistance levels. дальше »
2019-4-4 00:15 | |
|
|
Bitcoin Price Analysis: BTC/USD Remains at $4,050 Expecting Breakout
Coinspeaker Bitcoin Price Analysis: BTC/USD Remains at $4,050 Expecting BreakoutIn case the Bulls were able to penetrate the supply level of $4,050 upside and the bullish candle close above the level, $4,144 supply level may be its target. дальше »
2019-3-27 09:30 | |
|
|

Bitcoin Price Analysis: Bulls Must Defend $3800 By The Monthly Close
Bitcoin price has got off to a lackluster start, finding weekly lows of $3850, down from $3980 after finishing the week on a fifth consecutive green candle. Let’s take a closer look at the BTC price action to look what may be in store for the final week of March. дальше »
2019-3-26 16:00 | |
|
|
TRON & IOTA Price Action – TRX Drops Out of Top Ten Cryptocurrencies
Tron has formed three consecutive Doji candles on the weekly chart showing a high level of uncertainty from traders regarding the price prospects for the eleventh-ranked cryptocurrency by market cap. дальше »
2019-3-25 13:59 | |
|
|

Bitcoin Price Analysis: Bears Look to Trap Bulls Into Weekly Close
As the Bitcoin price weekly candle draws towards a close for the week we take a look at what the performance over the week looks like going into the final week of March. Bitcoin price: 4-HOUR CHART Looking at the4-hour chart, we can see that the bitcoin price has spent the last few days oscillating around the weekly opening price of $3965, with the bears continually attacking this level. дальше »
2019-3-24 22:30 | |
|
|
Ripple’s XRP & Stellar Lumens [XLM] Price Action – Both Consolidate, but More Price Movement from XLM
XRP is close to recording another week with a Doji candle. A Doji candle is a candle where the open and the close are around the same point and typically reflects uncertainty from traders. Price has not made a significant move on the weekly chart for XRP since early January. дальше »
2019-3-24 14:39 | |
|
|
XRP Price Analysis: XRP/USD is Getting Ready for the Breakout
Coinspeaker XRP Price Analysis: XRP/USD is Getting Ready for the BreakoutXRP price will rally to the north and make the supply level of $0. 33 if the bullish candle breaks the $0. 32 level close above it. дальше »
2019-3-20 19:48 | |
|
|

Tron [TRX] & IOTA Price Action – Traders Uncertain As Both Continue to Consolidate
Tron closed last weeks candle as a Doji reflecting the uncertainty from traders regarding the future price prospects of Tron. A Doji candle is a candle where the open and the close are around the same point and typically reflects uncertainty from traders. дальше »
2019-3-18 15:04 | |
|
|
Ripple’s XRP & Stellar Lumens [XLM] Technical Analysis: XRP Continues Consolidation While XLM Outperforms
XRP continues to consolidate despite most altcoins recording increases in relation to both USD and bitcoin over the past week. XRP looks likely to form yet another Doji candle on the weekly chart for this week of price action. дальше »
2019-3-17 14:44 | |
|
|

Bitcoin Price Analysis: Why BTC Bulls Are Charging at $4000
Bitcoin price broke out overnight and retested the $4k handle for the sixth time since the lows of the middle of December 2018. Let’s take a look at what this might mean going into the rest of the weekend. дальше »
2019-3-16 11:30 | |
|
|
Ethereum [ETH] & EOS Price Action – Dragonfly Doji Setting EOS up to Outperform?
EOS recorded a strong performance in February, but this is being followed up in March with consolidation in price action. This is reflected on the monthly chart with the March candle so far forming a Doji candle. дальше »
2019-3-13 18:05 | |
|
|

Bitcoin Price Analysis: Low Time Frames Show Signs of Life Amid Weekly Tests
Bitcoin continues to coil tightly within its range-bound market as the bulls and bears fight it out to see which is most dominant. On the lower time frames (TF), bitcoin is managing to find support:Figure 1: BTC-USD, 2-Hour Candles, Low TF SupportThe zone outlined by the green line in Figure 1 represents local support that has kept the market afloat for the last week and a half. дальше »
2019-3-13 22:26 | |
|
|
Ethereum Price Analysis: ETH/USD Breaks Out at $134 Targeting $125 Demand Level
CoinSpeaker Ethereum Price Analysis: ETH/USD Breaks Out at $134 Targeting $125 Demand LevelIn case Ethereum price goes down below $134 with the bearish candle close below the level right down there, then the bears will drive ETH price towards $125 price level. дальше »
2019-3-12 11:27 | |
|
|
Bitcoin Price Analysis: New High Paves Potential Reversal Setup
After days and days of consolidation, bitcoin finally managed to break a new high for the first time in almost two weeks. This new high, so far, has been short lived, however, as it was almost immediately sold into by eager bears:Figure 1: BTC-USD, 4-Hour Candles, New HighOur current 4-hour candle is seeing a relatively easy retracement after days and days of an upward grind. дальше »
2019-3-9 02:08 | |
|
|
Bitcoin Price Analysis: Short-Term Support Breaks on High Volume and Spread
Leading into the London open, bitcoin broke through its local support level in a move that seems to be hinting toward a downward continuation:Figure 1: BTC-USD, Daily Candles, Broken Local SupportSo far, our daily candle has yet to close, but it is currently on schedule to close below local support. дальше »
2019-3-5 02:43 | |
|
|

Bitcoin Price Analysis – A Grizzly Start to the Week
Bitcoin price closed the week up 1. 5% at $3789, despite the green candle close, the bears have taken control in the early hours of Monday morning, pushing Bitcoin price back into the $3600 range. дальше »
2019-3-4 18:00 | |
|
|
Bitcoin Price Analysis: Keep an Eye Out for a Close Above the Current High
Shortly after falling from its test of the low $4,000s, bitcoin managed to find support in the mid $3,500s. This has proven to be a relevant level over the last few months, and finding support here would be a sign of relatively strong demand:Figure 1: BTC-USD, Daily Candles, Local SupportThe high candle spread rejection following our test of the low $4,000s was an indication that we had strong levels of supply left in the market, but for the time being we are holding support. дальше »
2019-3-1 03:44 | |
|
|
Bitcoin Versus Binance Coin – BTC Consolidates As BNB Continues to Outperform
Bitcoin briefly dropped during yesterdays trading to around $3650 but quickly recovered to close and form a Doji on the daily chart. A Doji candle is a candle where the open and the close are around the same point and typically reflects uncertainty from traders. дальше »
2019-2-28 19:35 | |
|
|

Bitcoin Price Analysis: Bulls Look to Retest $4200 Into the Monthly Close
Bitcoin price is set to end a 6-month red candle losing streak today if the bulls can maintain a price above $3420. After a sharp $150 (4%) decline and subsequent sharp reversal, we take a look at the charts to try and get the lay of the land before the close. дальше »
2019-2-28 18:00 | |
|
|