Новости о Btc Indicator [ Фото новости ] [ Свежие новости ] | |

Bitcoin Price: Technical Flags Scream ‘Buy!’ as Market Nears Key Level
Bitcoin continues to grind higher, and on Monday the flagship cryptocurrency hit its highest level in 2019. Many investors are stuck in the past looking at the wild volatility brought on by excessive speculation, and ignoring that right here right now, the Bitcoin price is showing maturity and stability – and could be primed for a major boom. дальше »
2019-4-2 00:36 | |
|
|
Bitcoin Price Break Above $5,500 BTC/USD in Near Future as CNBC Bull Analyst: “Buy BTC”
Bitcoin Could Soon Break Above $5,500 In The Near Future Shows Technical Indicator Bitcoin has been traded close to $4,000 during the last few weeks, and it seems that there is a very interesting buying pressure under that level. дальше »
2019-3-24 01:14 | |
|
|
Bitcoin Price: Key Technical Indicator Shows BTC Surging to $5,500
Throughout the past three months, the bitcoin price has flirted with the $4,200 resistance level, often struggling to maintain momentum above the key $4,000 mark. Several traders have demonstrated concerns over the extended period of stability demonstrated by bitcoin because, in late 2018, the cryptocurrency recorded a drop of around 50 percent following three months of stagnation in the $6,300 to $6,500 range. дальше »
2019-3-24 21:30 | |
|
|
Technical Indicator Suggests That Bitcoin May Soon Plunge, But Will Growing BTC Adoption Stop This?
Bitcoin (BTC) has been firmly planted within the $3,000 region for the past several months and has failed to reach any price point that allows it to experience a sustainable price surge fueled by increased buying pressure. дальше »
2019-3-14 01:00 | |
|
|
Technical Indicator Shows Bitcoin (BTC) is Ready for a Meteoric Comeback, But When?
Bitcoin has firmly planted itself within the upper-$3,000 region over the past several weeks and has continued struggling to break above the low-$4,000 region. Because BTC has failed to garner any significant buying pressure over the past several weeks, some analysts believe that a drop back to its 2018 lows of $3,200 is inevitable. дальше »
2019-3-8 01:00 | |
|
|

Analyst: Buying Next Bitcoin (BTC) Pullback Could Lead to 30% Gains
Following its recent surge, Bitcoin has now found itself caught under $4,000, despite finding stability in the $3,900 region. Analysts are now claiming that BTC’s trading volume will likely be the best indicator as to if the cryptocurrency has enough buying pressure to propel its price above the important psychological price level of $4,000. дальше »
2019-2-22 01:00 | |
|
|
Bitcoin [BTC] Price: Is the Bear Market Over?
The odds that the bear market for cryptocurrencies is over drastically increased yesterday. Litecoin which often acts as a leading indicator for price movements in Bitcoin recorded a double-digit percentage increase in price early in the day and this was followed with increases in bitcoin and to altcoins. дальше »
2019-2-9 17:29 | |
|
|
Technical Indicator Suggest That There’s More Pain Ahead For Bitcoin (BTC) Bulls
The last 48 hours have seen Bitcoin hit a new year low. In the early hours of Monday, Bitcoin dropped from a little over $3,600 to hit a new year low of under $3,400. Altcoins dropped in tandem seeing the total market lose more than $6 billion. дальше »
2019-1-29 15:22 | |
|
|
Аналитики Bloomberg прогнозируют краткосрочное ралли биткоина
Ключевые технические параметры сигнализируют о том, что цена биткоина (BTC), вероятно, уже нащупала «дно» и стремится к краткосрочному повышению. Такое мнение выразили аналитики Bloomberg. Показатель GTI Global Strength Technical Indicator составляет 35. дальше »
2019-1-25 21:40 | |
|
|
Bloomberg: Цену биткойна ожидает краткосрочное ралли
Скоро цена на биткойн начнет краткосрочный цикл повышения, считают аналитики Bloomberg. По их мнению, на это указывают низкое значение показателя GTI Global Strength Technical Indicator и торговля на уровне чуть выше нижней границы индикатора GRI VERA Trend Signals. дальше »
2019-1-25 21:13 | |
|
|

Bitcoin [BTC]’s Price Approaches Oversold Territory, a Short-term Rally Could Be Ahead
According to a new Bloomberg report, technical indicators are showing an upside rally for Bitcoin could be near as the coin appears to have bottomed out. The GTI Global Strength Technical Indicator suggests that the coin is currently near oversold levels, which could signal a good entry point for investors. дальше »
2019-1-23 16:29 | |
|
|
Bloomberg & eToro Crypto Analyst Sentiments: A Bullish or Continued Bear Trend for BTC?
The crypto markets have begun the year on an uptrend after the bloodbath experienced during the better part of 2018. At the moment, we are looking at a possible new support level for BTC above $4,000. дальше »
2019-1-7 18:41 | |
|
|
DOGE/BTC Losses Don’t Hinder Dogecoin Price Stability
When it comes to gauging the overall cryptocurrency momentum, Dogecoin has become somewhat of a price indicator. When its value remains stable, Bitcoin is most likely going down. In today’s edition, it seems the Dogecoin price will remain at $0. дальше »
2018-12-10 22:24 | |
|
|
Bitcoin Price Charts ‘Death Cross’ In First Since 2014
Bitcoin’s (BTC) price woes may not be over just yet, as a specific "death cross" indicator is about to reoccur for the first time in four years. дальше »
2018-11-14 15:00 | |
|
|
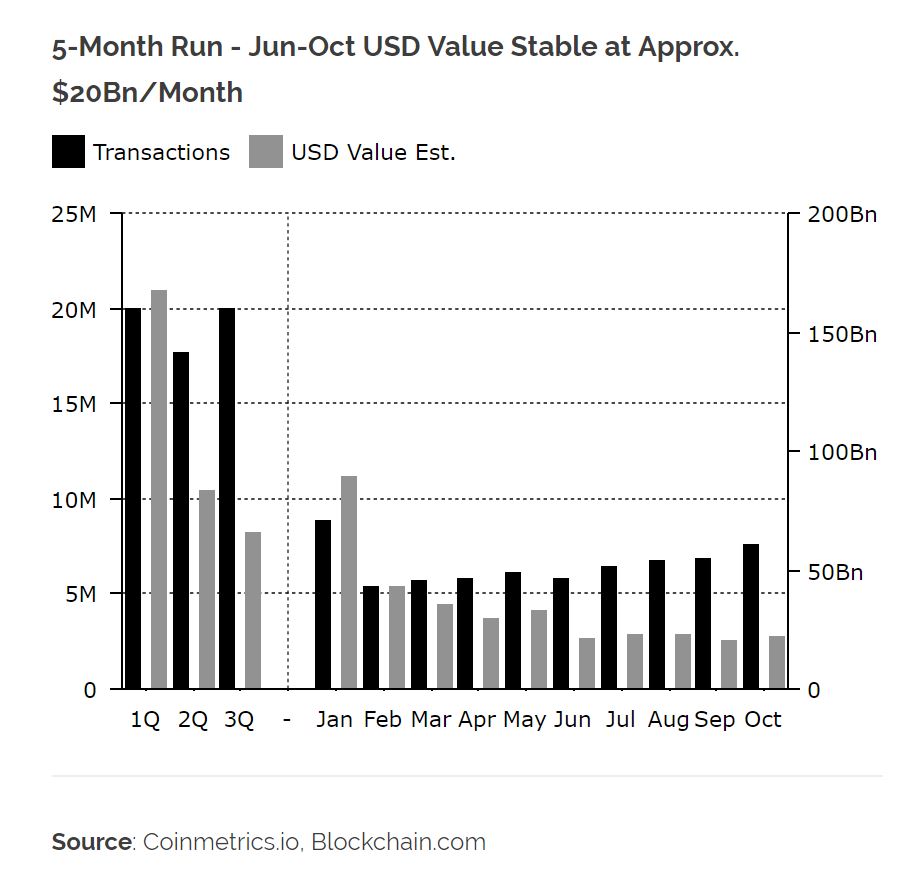
Bitcoin (BTC) Transaction Count On The Rise: Bullish, Not Bearish Indicator
On-Chain Bitcoin Transaction Count “Inches Upward” With another week, comes another insightful report from Diar, the crypto industry’s leading newsletter. In the publication’s most recent edition, which was released on Monday morning, Bitcoin (BTC), the so-called “king” of the crypto market, evidently remained a topic of focus. дальше »
2018-11-6 05:45 | |
|
|
Why Bitcoin (BTC)’s Price Is A False Indicator Of Actual Value
Chart for BTC/USD (1W) Bitcoin (BTC) is currently trading just above $6,400. The average cost for mining one Bitcoin (BTC) lies slightly below this level between $5,800 and $6,200. This is the reason the price has managed to stay above those levels for now despite the fact that the volume is so low that a couple of million dollars could swing the price either way. дальше »
2018-9-20 17:00 | |
|
|


CNBC ‘Reverse Bitcoin Price Indicator’ Hits Bullseye Again
Less than a week after CNBC forecast an $8000 Bitcoin price, the largest cryptocurrency tumbled close to $6000, leading to ridicule from commentators. ‘$8K Could Be Next’ In another instance of the network proving itself as a so-called ‘reverse price indicator,’ its predictions for BTC/USD completely contrasted with short-term reality, the pair going on to lose almost 13 percent in less than 24 hours. дальше »
2018-9-6 15:00 | |
|
|

CNBC Tweets Have Been a Contrarian Bitcoin Price Indicator With 95% Accuracy
According to research from prominent cryptocurrency trader Jacob Canfield, who plotted out his findings against a BTC price chart on the popular charting site TradingView, CNBC’s tweets can be used as a contrarian Bitcoin price indicator with as much as 95% accuracy. дальше »
2018-8-25 17:00 | |
|
|
Bitcoin (BTC) Strongly Defends $5,800 Support As Crypto Carnage Continues
Bitcoin (BTC) has held the $5,800 support so far even as crypto carnage continues. While most altcoins have already suffered double digit losses, Bitcoin (BTC) has held its ground as can be seen on the daily BTC/USD chart above. дальше »
2018-8-14 17:00 | |
|
|
Bitcoin (BTC) Likely To Find A Bottom between $5,000 And $3,000 This Year
Bitcoin (BTC) has run into resistance and now appears to have topped out once again as it sets for a pullback. EMA alignment for BTC/USD on the daily chart above continues to remain bearish. дальше »
2018-7-26 21:30 | |
|
|
Bitcoin’s (BTC) price clocked a two-month high of $7,820 today and looks set to extend gains further, a key cryptomarket gauge indicates. CoinMarketCap’s bitcoin dominance rate, an indicator that tracks the percent of the total cryptocurrency market
To start with, a rise in the BTC dominance rate essentially means the number one cryptocurrency is more in demand compared to the alternative cryptocurrencies. The above chart shows: The BTC dominance rate has increased from 40. дальше »
2018-7-23 18:29 | |
|
|
Technical analysis: Bitcoin [BTC] predictions based on Ichimoku, DMI, and Keltner Channels
An Ichimoku analysis of the Bitcoin price may suggest that a transitory bull run may be imminent for the month of July. This analysis combines technical analysis of a Directional Movement Indicator (DMI) and a Keltner Channel on the 1-Year charts. дальше »
2018-7-6 19:10 | |
|
|
Bitcoin Rallies to $6,400 as Market Indicator Predicts Major Price Push
On the last day of June, Bitcoin has managed a minor rally by gaining more than $500 in 24 hours. Unless a significant market downturn occurs, the top-ranked cryptocurrency may end the first half of the year trading at $6,500. дальше »
2018-7-1 23:40 | |
|
|
Hazard Flight? Bitcoin ‘Dominance Rate’ Hits 9-Week High
The BTC dominance rate is an indicator that tracks the percent of the total cryptocurrency market capitalization contributed by the leading cryptocurrency. So, a rising dominance rate essentially means the demand for bitcoin is greater than the demand for altcoins. дальше »
2018-6-27 19:59 | |
|
|