Новости о Bitcoin Chart [ Фото новости ] [ Свежие новости ] | |

Ripple’s XRP and Market Leader Bitcoin [BTC] Both Rise to Potential Resistance Points
XRP/USD Daily Chart: Market leader Bitcoin continued to form a new 2018 low this weekend as the market returned to bearish conditions Thursday. The bearish conditions resulted in Ripple’s XRP breaking below the range it had been forming between $0. дальше »
2018-12-16 16:49 | |
|
|
Bitcoin Price Weekly Analysis: BTC’s Short Term Rebound Likely
Key Points Bitcoin price traded to a new yearly low at $3,126 and later corrected a few points against the US Dollar. There was a break above a key bearish trend line with resistance at $3,220 on the 4-hours chart of the BTC/USD pair (data feed from Kraken). дальше »
2018-12-16 08:00 | |
|
|
Stellar [XLM]: When Will Price Hit the Bottom?
A look at the Weekly chart for Stellar in logarithmic form, shows us that price has been steadily declining since breaking the $0. 2 support, and the next area of support is found in the May 2017 high at $0. дальше »
2018-12-15 17:19 | |
|
|
Ripple [XRP]: Will Support Hold or Are We Heading Downward?
A look at the Weekly chart of Ripple in logarithmic form, shows us that price has fallen from the high of January 2018 of around $3.2 to close to $0.3. There is some support in the $0.3 area, and it is worth noting that there was a bounce with strong volume in September (yellow arrow), […] Ripple [XRP]: Will Support Hold or Are We Heading Downward? was originally found on [blokt] - Blockchain, Bitcoin & Cryptocurrency News. дальше »
2018-12-15 16:19 | |
|
|
Bitcoin SV (BSV) Long-term Price Analysis – December 15
BSV/USD Long-term Trend – Bearish Distribution territories: $100, $150, $200 Accumulation territories: $60, $50, $40 From the chart reading, the BSV/USD market has been seeing more of downwards than upwards in its price valuation movements since December 8 until the present time. дальше »
2018-12-15 12:11 | |
|
|
Bitcoin (BTC) Long Term Price Forecast- December 15
BTC/USD Long-term Trend: Bearish Resistance levels: $7,200, $7,400, $7,600 Support levels: $3,100, $2,900, $2,700 The BTC/USD pair had been in a bearish trend. From the weekly chart, the price of Bitcoin had been range bound from the month of March to November 12, 2018. дальше »
2018-12-15 09:54 | |
|
|
Tron [TRX] Analysis: Price Trying to Find a Bottom With No Support Area in Sight
A look at the weekly chart for TRX shows us that after the highs of January 2019 at $0. 35, TRX has lost 97% of its value, and is now trading at around $0. 01. While this is the lowest price has been after the fall, it is not clear if we have made a bottom. дальше »
2018-12-14 14:29 | |
|
|
Bitcoin Price Watch: BTC Sellers Target Breakdown Below $3,000
Key Points Bitcoin price declined further and broke the $3,295 and $3,200 supports against the US Dollar. There was a break below a major contracting triangle with support at $3,355 on the hourly chart of the BTC/USD pair (data feed from Kraken). дальше »
2018-12-14 10:00 | |
|
|
EOS Now Trading in a Range After Its Steep Decline
BTC/USD Daily Chart: With the market leader Bitcoin meeting key support at $3300, other major cryptocurrencies are behaving similarly and halting their declines. EOS is one of the major cryptocurrencies which is recording some more bullish movements after a steep decline which took place amid the bearish market conditions. дальше »
2018-12-13 18:54 | |
|
|
Litecoin [LTC] – Will the Support Area Hold, or Is There Another Drop in Store?
A look at the logarithmic Weekly chart shows us that price has fallen all the way into the $20-$25 area of support created by the highs of 2014. There is a substantial amount of support here. If price were to break down below $20, the next level of support would be in the $3-$5 area, […] Litecoin [LTC] – Will the Support Area Hold, or Is There Another Drop in Store? was originally found on [blokt] - Blockchain, Bitcoin & Cryptocurrency News. дальше »
2018-12-13 16:34 | |
|
|
Bitcoin Price Watch: BTC Sellers Targets Fresh Weekly Lows
Key Points Bitcoin price failed to break the $3,475 and $3,485 resistance levels and declined against the US Dollar. There was a break below an ascending channel with support at $3,405 on the hourly chart of the BTC/USD pair (data feed from Kraken). дальше »
2018-12-13 10:00 | |
|
|
Ripple’s XRP Continues Range Trading As Market Leader Bitcoin [BTC] Finds Support
BTC/USD Daily Chart: The largest altcoin by market cap, Ripple’s XRP, has been trading in a range from around $0. 29 to $0. 31. This comes as Bitcoin has found strong support around $3300 and there is increasing buyer momentum seen by both the daily MACD and RSI rising. дальше »
2018-12-12 18:48 | |
|
|
Dash: After the Fall, Where Does Price Find Support?
As we can see from the Weekly chart, DASH has fallen 96% from its January highs of around $1500 and is now trading in the $60 range. There is some support at the $60-65 area, but it is not a substantial support area. дальше »
2018-12-12 17:24 | |
|
|
Bitcoin SV Price Analysis: BSV/USD Trends of December 12–18
CoinSpeaker Bitcoin SV Price Analysis: BSV/USD Trends of December 12–18 “Double bottom” pattern was formed as it is clearly seen on the chart which indicates that BSV price may hit $92 price level in which if the level is broken the coin may have its high at $96 price level. дальше »
2018-12-12 15:38 | |
|
|
Bitcoin Price Watch: BTC Hesitates, But Further Losses Seem Likely
Key Points Bitcoin price remains in a bearish zone below the $3,400 and $3,500 resistances against the US Dollar. This week’s followed key bearish trend line is in place with resistance at $3,440 on the hourly chart of the BTC/USD pair (data feed from Kraken). дальше »
2018-12-12 10:00 | |
|
|
Bitcoin [BTC] Price Reverses Weekend Gains and Heads Towards Lower Low
Bitcoin’s weekly chart shows its price is trading in a historic area of support and resistance. A break below the $3000 support line opens up the possibility of Bitcoin declining to $2000. дальше »
2018-12-11 18:44 | |
|
|
Monero [XMR]: Is a Bounce in Store or Are We Heading for the Bottom?
A look at the weekly chart of Monero (XMR), shows that we broke the $75 level of support which had been holding since the beginning of the summer and is now heading lower. The two support areas to watch are the $25-30 area formed by the lows of July 2017 (less likely to hold), and […] Monero [XMR]: Is a Bounce in Store or Are We Heading for the Bottom? was originally found on [blokt] - Blockchain, Bitcoin & Cryptocurrency News. дальше »
2018-12-11 17:54 | |
|
|
Bitcoin Oversold on Weekly Price Chart for First Time in Four Years
A key long-term bitcoin price indicator is reporting oversold conditions for the first time in almost four years. дальше »
2018-12-11 14:00 | |
|
|
Bitcoin Price Watch: BTC Facing Uphill Task Near $3,500
Key Points Bitcoin price is under pressure below the $3,500 and $3,520 resistance levels against the US Dollar. Yesterday’s highlighted crucial bearish trend line is intact with resistance at $3,520 on the hourly chart of the BTC/USD pair (data feed from Kraken). дальше »
2018-12-11 10:00 | |
|
|
Price Analysis: Bitcoin SV Targets $100 Breakout, Bull Run in sight?
Resistance levels: $103, $113, $123 Support levels: $93, $85, $73 BSV/USD Medium-term Trend: Ranging On the 4-Hour chart, BSV/USD is ranging. There was a bullish momentum on December 6, from the support level of $85, broke up the resistance levels of $93 and $103 and topped at $113. дальше »
2018-12-10 13:32 | |
|
|
Bitcoin Price Watch: Break Above $3,700 Could Push BTC Higher
Key Points Bitcoin price recovered recently and moved above the $3,500 resistance against the US Dollar. There is a key bearish trend line in place with resistance at $3,590 on the hourly chart of the BTC/USD pair (data feed from Kraken). дальше »
2018-12-10 10:00 | |
|
|
Bitcoin (BTC) Price Analysis: Some Bullish Hints
Bitcoin is still trending lower inside a descending channel on the 1-hour chart but is currently testing the resistance to attempt another break. However this lines up with an area of interest or former support that might now hold as a ceiling. дальше »
2018-12-10 05:02 | |
|
|
Bitcoin Price Weekly Analysis: BTC Sellers In Control Below $3,600
Key Points Bitcoin price extended losses below the $4,000 and $3,600 supports against the US Dollar. There is a significant bearish trend line formed with resistance at $3,630 on the 4-hours chart of the BTC/USD pair (data feed from Kraken). дальше »
2018-12-9 09:00 | |
|
|
Bitcoin Cash Price Weekly Analysis: BCH/USD Could Struggle Near $120
Key Points Bitcoin cash price declined heavily and even broke the $100 support against the US Dollar. There is a crucial bearish trend line formed with resistance at $120 on the 4-hours chart of the BCH/USD pair (data feed from Kraken). дальше »
2018-12-9 07:28 | |
|
|
Coinbase chart is a harsh reminder of cryptocurrency’s terrible 2018
For those that bought Bitcoin in 2009, or even in 2011, I can only hope you’ve already sold it. For those that bought Bitcoin in 2017, well… sorry? Coinbase, one of the largest places to buy cryptocurrency online, seems to want you to revel in the Bitcoin‘s failures. дальше »
2018-12-8 05:19 | |
|
|
Bitcoin Price Watch: BTC/USD Primed To Test $3,000
Key Points Bitcoin price declined further and broke the $3,550 and $3,420 support levels against the US Dollar. There is a major bearish trend line formed with resistance at $3,700 on the hourly chart of the BTC/USD pair (data feed from Kraken). дальше »
2018-12-7 13:00 | |
|
|
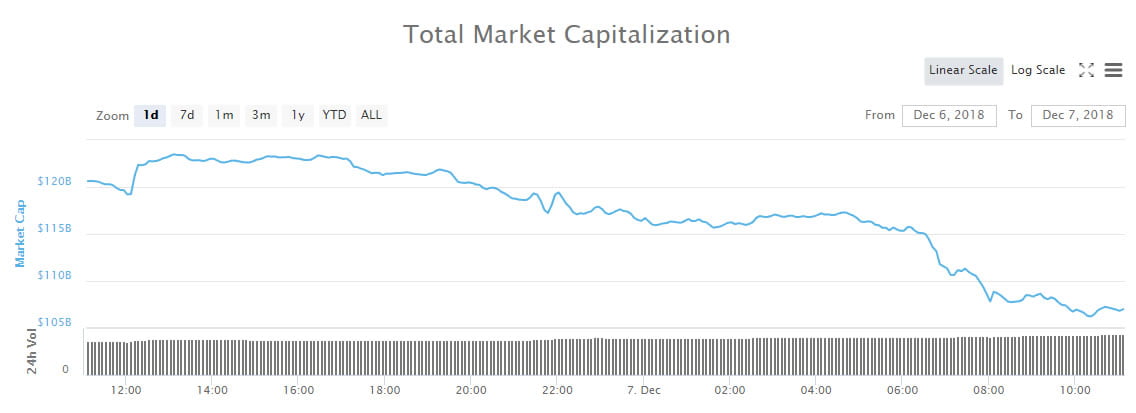
Red Friday: $15 Billion Slide Dumps Crypto Markets to New 16 Month Low
FOMO Moments Crypto markets plunging perilously low; Bitcoin Cash and EOS collapsing, Bitcoin SV climbing the chart. The slow selloff that has been happening all week has accelerated today as crypto markets crash to their lowest levels of 2018. дальше »
2018-12-7 12:00 | |
|
|
Bitcoin Cash Price Analysis: BCH/USD Nosedives Below $100, $80 Next?
Key Points Bitcoin cash price tumbled and broke the $125 and $100 support levels against the US Dollar. There is a monster bearish trend line in place with resistance at $120 on the hourly chart of the BCH/USD pair (data feed from Kraken). дальше »
2018-12-7 07:28 | |
|
|
Market manipulation? Why is Bitcoin SV Rapidly Increasing in Price Despite Widespread Bearish Market?
Termed as the original Bitcoin, Craig Wright’s cryptocurrency dubbed as Bitcoin Satoshi Vision has been showing green lights on the market chart amidst tons of other top cryptocurrencies swimming in losses. дальше »
2018-12-7 22:06 | |
|
|
Bitcoin Mining is Still Almost 50% More Profitable to Miners than Bitcoin SV
CoinSpeaker Bitcoin Mining is Still Almost 50% More Profitable to Miners than Bitcoin SV Bitcoin Cash price is under a lot of pressure after it broke the $150 support against the US Dollar. дальше »
2018-12-6 13:22 | |
|
|
Bitcoin Price Watch: BTC/USD Bounce From Lows Could Fade Soon
Key Points Bitcoin price declined and broke the last swing low at $3,730 against the US Dollar. There are two crucial bearish trend lines in place with resistance at $3,850 and $3,900 on the hourly chart of the BTC/USD pair (data feed from Kraken). дальше »
2018-12-6 12:28 | |
|
|
Bitcoin Cash Price Analysis: BCH/USD Primed To Test $100
Key Points Bitcoin cash price is under a lot of pressure after it broke the $150 support against the US Dollar. There is a major declining channel formed with resistance near $135 on the hourly chart of the BCH/USD pair (data feed from Kraken). дальше »
2018-12-6 10:30 | |
|
|
Bitcoin (BTC) Price Analysis: Short-Term Falling Wedge Pattern
Another consolidation pattern can be spotted on bitcoin as price is moving inside a falling wedge on its short-term chart. Price is down to support and might be due for yet another bounce to the top around $3,800. дальше »
2018-12-6 06:35 | |
|
|
Bitcoin Price Watch: BTC/USD Remains In Downtrend Below $4,020
Key Points Bitcoin price failed to break the $4,080 resistance level and declined recently against the US Dollar. Yesterday’s highlighted two key bearish trend lines are active with resistance near $4,000 and $4,090 on the hourly chart of the BTC/USD pair (data feed from Kraken). дальше »
2018-12-5 12:28 | |
|
|
Bitcoin Cash Price Analysis: BCH/USD Crashes Below $150
Key Points Bitcoin cash price traded further lower and broke the $150 support level against the US Dollar. There is a new connecting bearish trend line formed with resistance near $148 on the hourly chart of the BCH/USD pair (data feed from Kraken). дальше »
2018-12-5 07:28 | |
|
|
Bitcoin Price Watch: BTC/USD Facing Major Resistance Near $4,150
Key Points Bitcoin price declined further below $3,900 and traded towards the $3,750 level against the US Dollar. There are two important bearish trend lines in place with resistance near $4,080 and $4,150 on the hourly chart of the BTC/USD pair (data feed from Kraken). дальше »
2018-12-4 12:28 | |
|
|
Bitcoin Cash Price Analysis: BCH/USD Could Extend Losses Below $150
Key Points Bitcoin cash price broke the $170 and $165 support levels plus extended losses against the US Dollar. There is a major bearish trend line formed with resistance near $168 on the hourly chart of the BCH/USD pair (data feed from Kraken). дальше »
2018-12-4 07:28 | |
|
|
Bitcoin Price Watch: BTC/USD Remains Sell Near $4,200
Key Points Bitcoin price traded lower recently and broke the $4,120 support area against the US Dollar. There is a key bearish trend line in place with resistance at $4,180 on the hourly chart of the BTC/USD pair (data feed from Kraken). дальше »
2018-12-3 12:28 | |
|
|
Bitcoin Cash Price Analysis: BCH/USD Under Pressure Below $180
Key Points Bitcoin cash price failed to trade above $175-180 and declined sharply against the US Dollar. There are two key bearish trend lines formed with resistance near $175 on the hourly chart of the BCH/USD pair (data feed from Kraken). дальше »
2018-12-3 07:28 | |
|
|
Bitcoin Price Weekly Analysis: BTC/USD Remains In Downtrend Below $4,500
Key Points Bitcoin price recovered recently and traded above the $4,000 and $4,200 levels against the US Dollar. There is a key bearish trend line formed with resistance at $4,320 on the 4-hours chart of the BTC/USD pair (data feed from Kraken). дальше »
2018-12-2 09:28 | |
|
|
Bitcoin Cash Price Weekly Analysis: BCH/USD Could Decline Below $160
Key Points Bitcoin cash price is currently consolidating and it could decline below $160 against the US Dollar. There is a major bearish trend line formed with resistance at $190 on the 4-hours chart of the BCH/USD pair (data feed from Kraken). дальше »
2018-12-2 07:28 | |
|
|
2018’s Bitcoin (BTC) Chart Mirrors Last Bear Market: ‘Bulls May Awaken’
“This Chart [May] Awaken Bitcoin (BTC) Bulls” Analysis completed by Fundstrat technician Rob Sluymer, which was subsequently relayed through MarketWatch’s Aaron Hankin, indicates that the current Bitcoin (BTC) price chart entirely mirrors that seen in late-2014 and early-2015, this market’s last dismal bear market. дальше »
2018-12-1 05:38 | |
|
|
Bitcoin Price Watch: BTC/USD Could Extend Correction Below $4,100
Key Points Bitcoin price struggled to break the $4,400-4,440 resistance and declined against the US Dollar. There was a break below yesterday’s bullish trend line with support at $4,220 on the hourly chart of the BTC/USD pair (data feed from Kraken). дальше »
2018-11-30 12:00 | |
|
|
Bitcoin Cash Price Analysis: BCH/USD Consolidating Below $200
Key Points Bitcoin cash price remained below the $200 resistance and corrected lower against the US Dollar. There is a major bearish trend line formed with resistance near $193 on the hourly chart of the BCH/USD pair (data feed from Kraken). дальше »
2018-11-30 07:28 | |
|
|
Bitcoin Price Watch: BTC/USD Turned Short Term Bullish
Key Points Bitcoin price climbed higher and broke the $4,080 and $4,200 resistance levels against the US Dollar. There is a short term bullish trend line formed with support at $4,050 on the hourly chart of the BTC/USD pair (data feed from Kraken). дальше »
2018-11-29 12:28 | |
|
|
Bitcoin Cash Price Analysis: BCH/USD Approaching Next Break
Key Points Bitcoin cash price failed to break the $195 and $198 resistance levels against the US Dollar. There is a crucial contracting triangle forming with resistance near $198 on the hourly chart of the BCH/USD pair (data feed from Kraken). дальше »
2018-11-29 09:28 | |
|
|
Bitcoin Price Watch: BTC/USD Ran Into Resistance, More Gains Likely
Key Points Bitcoin price climbed higher recently and traded above the $3,800 resistance level against the US Dollar. This week’s crucial bearish trend line was breached with resistance at $3,830 on the hourly chart of the BTC/USD pair (data feed from Kraken). дальше »
2018-11-28 12:28 | |
|
|
Bitcoin Cash Price Analysis: BCH/USD Remains Sell Near $200
Key Points Bitcoin cash price settled below the $190 and $200 support levels against the US Dollar. There was a break below an ascending channel with support at $172 on the hourly chart of the BCH/USD pair (data feed from Kraken). дальше »
2018-11-28 07:28 | |
|
|
Bitcoin Price Watch: BTC/USD Buyers Facing Uphill Task
Key Points Bitcoin price struggled to break the $4,120 resistance area and declined against the US Dollar. Yesterday’s highlighted crucial bearish trend line is active with resistance at $3,900 on the hourly chart of the BTC/USD pair (data feed from Kraken). дальше »
2018-11-27 12:45 | |
|
|