Новости о Below Low [ Фото новости ] [ Свежие новости ] | |

$20k by 2041 False Even if Bitcoin (BTC) Is Maturing With Deep Liquidity
Bitcoin (BTC) trend is bullish but below Apr-11 highs Analyst says Bitcoin (BTC) may take 22 years to re-test 2017 highs Accompanying firm upsides is shifting sentiment and recovering prices. At spot rates, Bitcoin (BTC) gains are low, but even so, it is volatile enough and attractive for risk-off traders. дальше »
2019-4-19 22:00 | |
|
|
Ripple (XRP) Price Approaching Key Resistance, Can Buyers Make It?
Ripple price traded as low as $0. 3134 and recently corrected higher against the US dollar. The price broke the $0. 3200 resistance area, but it is still below the key $0. 3280 resistance. Yesterday’s highlighted key bearish trend line is intact with resistance near $0. дальше »
2019-4-17 08:00 | |
|
|
Ripple (XRP) Price Could Retest $0.3000 Before Fresh Upside
Ripple price failed near the $0. 3370 level and declined below the $0. 3250 support against the US dollar. The price traded to a new weekly low at $0. 3134 and remains at a risk of more losses in the short term. дальше »
2019-4-16 08:00 | |
|
|
Bitcoin Beats a Retreat Below $5k, Has The Final Capitulation Started?
The inevitable pullback has started and crypto markets are beating a retreat at the moment. Bitcoin is leading them down as it drops back below $5,000 dumping 6 percent on the day. The question now is how low will it go? Minor Pullback or Major Correction? A number of analysts had predicted a major capitulation. дальше »
2019-4-12 11:30 | |
|
|
Litecoin Price Prediction Today: Daily (LTC) Value Forecast – April 8
The LTC price is currently trading at $89. 26 as at the time of witing. On the downside, if the bears break below the EMAs, the LTC price is likely to fall to the previous low at either $81 or $87 price level . дальше »
2019-4-8 10:17 | |
|
|
Could the Bitcoin Price Flirt with Low $3,000 BTC/USD Ranges or Never Fall Below $3,100 Ever Again?
Sometime back, the price of Bitcoin sat somewhere around $3,150, vacillating around that figure. However, within a week, the price successfully shot past $4,000 causing some excitement. Shortly after the $4,000 mark was crossed, people started to have conversations around what the lowest price for Bitcoin really was. Morgan Creek Digital’s Anthony Pompliano, who is […] дальше »
2019-4-8 02:03 | |
|
|
Bitcoin Ridiculously Overbought – One Trader Says it Will Still Go ‘Parabolic’
Now that the bitcoin price has broken above the $5,000 mark to set a new 2019 high, crypto traders are anxiously watching the charts to discern whether the flagship cryptocurrency will slaughter its next major resistance wall at $6,000 to triumphantly initiate a new bull market. дальше »
2019-4-6 19:45 | |
|
|
Dogecoin Price Prediction Today: Daily (DOGE) Value Forecast – April 5
The DOGE price is currently trading at the $0. 003507 as at the time of writing. On the downside, if the bears break below the EMAs, the crypto’s price will fall to the low at $0. 00300 price level. дальше »
2019-4-5 09:54 | |
|
|
Bitcoin Price Careens Lower But Bullish Trend Survives
The bitcoin price on Thursday depreciated as much as 10. 33-percent against the US dollar. The cryptocurrency reached an intraday low at $4,833 in an interim bearish correction. It was already trending inside an overbought zone when the downside action started. дальше »
2019-4-5 01:00 | |
|
|
152% Gains: Here are March’s Best and Worst Crypto Performers
March has been a positive month for the cryptocurrency market on the whole. The 31-day period saw the cryptocurrencies’ combined market capitalization dropping to as low as $125. 09 billion, and rising to as high as $146. дальше »
2019-4-1 17:40 | |
|
|
Dow in Crisis? Analyst Phil Blancato Warns Stock Market is Overbought
By CCN. com: The Dow Jones Industrial Average has added nearly 400 points since March 27, within three days, surging from 25,462 to 25,867. When zoomed out, however, the Dow has struggled to demonstrate strong momentum above the 26,000 level ever since it dipped below that key level on March 1. дальше »
2019-3-30 20:46 | |
|
|
Verge Price Prediction Today: Daily (XVG) Value Forecast – March 29
On the upside, if price is sustained above the 12-day EMA and the 26-day EMA. the crypto's price is likely to reach a high of $0. 007600. On the other hand, if the crypto’s price breaks below the EMAs, the price will fall to a low at $0. дальше »
2019-3-29 10:36 | |
|
|
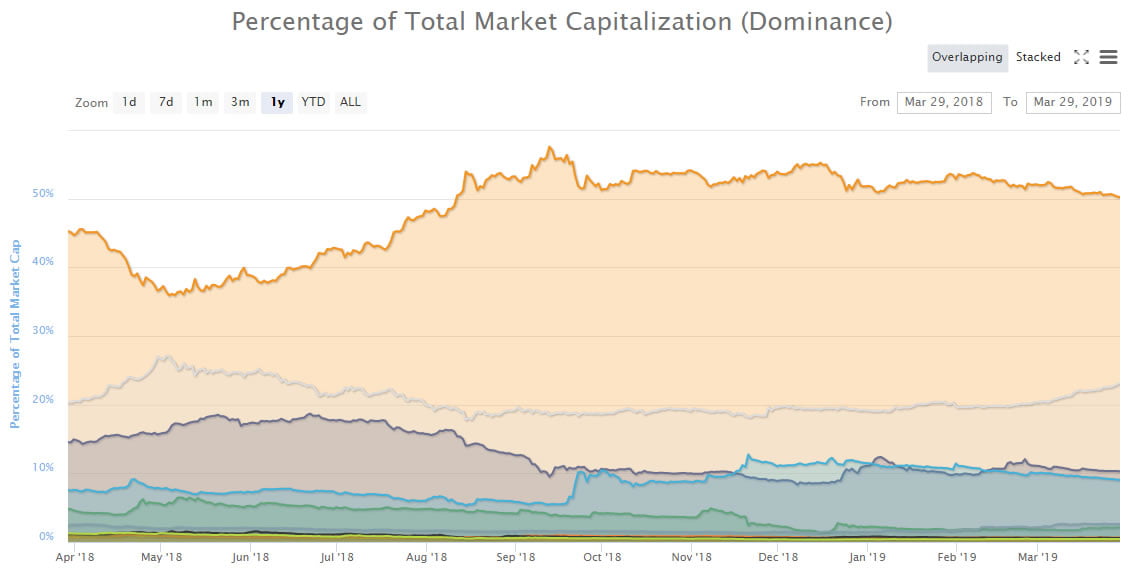
Crypto Market Wrap: Bitcoin Dominance Hits Seven Month Low, About to Drop Below 50%
Crypto markets cooling as the week ends; Cardano, Tezos and BAT climbing, Maker pulling back. Market Wrap Crypto markets are ending the week on a high but it remains to be seen if the momentum will continue into the weekend. дальше »
2019-3-29 10:00 | |
|
|

Bitcoin Price Analysis: Upward Drift Continues Following Established Macro Support
Since mid-February, the bitcoin market has continued to drift upward toward a band of strong, macro resistance (shown below as a red band). This slow, drift upward marks our fourth test of the resistance zone and, unlike the three prior tests, our rejection of the level has shown a weakness on the side of the bears:Figure 1: BTC-USD, Daily Candles, Fourth RejectionIf we compare the three prior rejections (labeled 1, 2 and 3), we see that the move into this resistance level was violent — and had equally violent rejections. дальше »
2019-3-29 02:21 | |
|
|
Open Market Cap Research: Bitcoin (BTC) Volumes 6X Those of Ethereum
Bitcoin price stable below $4,200 Bitcoin market cap share is 52 percent Transaction volumes low but bullish divergence could help lift prices Most crypto exchanges are deliberately inflating volumes according to a follow up analysis by Open Market Cap (OMC). дальше »
2019-3-28 22:00 | |
|
|
Another Hack Coincides with Ethereum (ETH) Price Drop, Back to $100?
Ethereum prices bearish and likely to sink below $135 Hackers wreak havoc at Dragon EX, steal user funds Transaction volumes low but could surge as bears retest key support levels Another exchange, Dragon EX, has been breached and user fund stolen demonstrating why it is imperative for assets to be stored at cold wallets away. дальше »
2019-3-27 21:00 | |
|
|
Binance Coin (BNB) Price Skyrockets Following Launchpad Update
While Bitcoin has slipped below the critical $4000 mark after several days of low price volatility, Binance Coin (BNB) was one of the largest price gainers over the weekend. Binance Coin, the native currency for. дальше »
2019-3-26 00:20 | |
|
|
Will Bitcoin Shine? After Ponzi Jab, BIS Boss Says CBDC Destabilizing
Bitcoin price under pressure Carstens of BIS against central bank digital currencies (CBDCs) Volumes low and drop below or above Mar 21 high-lows must exceed 13k According to BIS’s Carstens, central banks shifting to CBDCs will destabilize the economy. дальше »
2019-3-24 20:00 | |
|
|
Ripple (XRP) Unbridled Rally (or Dump) Will be After Status Clarification
Ripple prices flat-line below 34 cents Jake Chervinsky, a crypto lawyer, believes ongoing civil suit against Ripple will settle next year Volumes low, averaging 15 million. Eventual clarification of XRP’s status will either cause a rally or a meltdown as owners liquidate their holdings escaping SEC’s incoming oversight. дальше »
2019-3-23 20:00 | |
|
|
How Bitcoin Higher High Formation Could Push It to $2,000
The next upside push in the bitcoin market could prompt the cryptocurrency a form new bottom below $3,100. Josh Rager, a hugely followed cryptocurrency market analyst, pitted the current bitcoin price action against another one from the year 2015. дальше »
2019-3-22 17:16 | |
|
|
Bitcoin Share of Total Crypto Market Falls Below 51% to Its 3 Months Low
Coinspeaker Bitcoin Share of Total Crypto Market Falls Below 51% to Its 3 Months LowBitcoin dominance has fallen to a three month low. This could indicate that investors are moving into riskier assets, with renewed confidence in virtual assets and a bullish outlook for the market. дальше »
2019-3-20 11:11 | |
|
|
DASH Price Prediction Today: Daily (DASH) Value Forecast – March 19
The crypto’s price fell to the low of $92. 58 and was trending at the support of the 26-day EMA. On the upside, if the price is holding at the 26-day EMA, then the crypto’s price is likely to rise to retest the $96 resistance level. дальше »
2019-3-19 10:31 | |
|
|
Ethereum Price Analysis: ETH Turned Vulnerable Below $140
ETH price failed to climb above the $140-141 resistance area and declined against the US Dollar. The price even broke the $137 support level and traded to a new weekly low near $135. This is a major bearish trend line formed with resistance at $140 on the hourly chart of ETH/USD (data feed via Kraken). дальше »
2019-3-19 07:08 | |
|
|
Bitcoin Price Analysis: Slow Grind Could Lead to Short Squeeze
Last Friday, we discussed a macro resistance level bitcoin would likely test. The level was tested three times prior and immediately rejected. Now, for the fourth time, we find ourselves situated above the level as we wait to see if our support holds:Figure 1: BTC-USD, Daily Candles, Fourth Test of Macro ResistanceThe first three attempts to hold support above the black, broken resistance have been stifled with relatively high amounts of volume. дальше »
2019-3-19 01:17 | |
|
|
Bitcoin Price Slips at $4,000; A Minor Pullback Before a Major Rally?
Following a spike to $4,068 from the low $3,900 region, the bitcoin price has experienced a slight pullback to $4,000. While the price of bitcoin slightly differs from region to region, on average, bitcoin is currently being traded at $4,017. дальше »
2019-3-17 14:10 | |
|
|
Bitcoin Price Analysis: Could Three Times Be the Charm for This Resistance Level?
Bitcoin remains in its tightly coiled range as the market continues its sideways trend for the third week in a row. While macro support has been tested three times recently, we have yet to test the overhanging macro resistance:Figure 1: BTC-USD, Daily Candles, Narrow RangeThe blue zone outlined above shows a very strong zone of support that, over the last few weeks, has seen three strong tests and has led to a slowly upward-drifting market consolidation. дальше »
2019-3-16 01:56 | |
|
|
XRP Daily Price Forecast – March 14
The crypto’s price is making a downward correction to a low at $0. 31. If the bears break below the EMAs, it would have erased the bullish gains of the previous day. XRP/USD Medium-term Trend: Bullish Resistance Levels: $ 0. дальше »
2019-3-14 12:06 | |
|
|
Ethereum (ETH) Daily Price Forecast – March 14
The crypto’s price may fall to the previous low at $127.50. The crypto’s price is below the 12-day EMA and the 26-day EMA which indicates that price is likely to fall. ETH/USD Medium-term Trend: Bearish Resistance Levels: $240, $250, $260 Support Levels: $140, $130, $120 Yesterday, March 13, the price of Ethereum was in a […] дальше »
2019-3-14 11:09 | |
|
|
Bitcoin Could Plunge 50% with November-Like Dump amid Low Volatility: Analysts
Bitcoin has struggled to cleanly break out of the $4,000 resistance level and remain above it for more than three months, staying in a tight range between $3,300 to $4,000. If the dominant cryptocurrency fails to test $4,000 again and slips, traders foresee the Bitcoin price declining to the $3,300 to $3,500 range. дальше »
2019-3-13 11:30 | |
|
|
Ripple (XRP) Squeeze, A Major Breakout Is on the Cards
Ripple prices below 34 cents, in range mode JPM Coin not a threat, Brad Garlinghouse assures Transactional volumes low, averaging 14 million Brad Garlinghouse, the CEO of Ripple Inc, is confident that JPM Coin private nature is not a threat to XRP. дальше »
2019-3-11 21:00 | |
|
|
Ethereum (ETH) Daily Price Forecast – March 11
Today, the ETH price is ranging below the EMAs but above the $137 price level. On the downside, if the bearish trend continues, the crypto’s price will fall to the previous low at $125. ETH/USD Medium-term Trend: Ranging Resistance Levels: $240, $250, $260 Support Levels: $140, $130, $120 Last week, the price of Ethereum was […] дальше »
2019-3-11 08:59 | |
|
|
Bitcoin (BTC) Struggles With Key Resistance Position But Positive Sentiment Persists
The weekend has seen the market pullback and drops slightly below $135 billion. This has been the cause of a number of top coins turning bearish in the last couple of hours. After bouncing back positively from the week’s low, Bitcoin has been able to climb above $3,900. дальше »
2019-3-9 09:30 | |
|
|
Bitcoin Price Analysis: New High Paves Potential Reversal Setup
After days and days of consolidation, bitcoin finally managed to break a new high for the first time in almost two weeks. This new high, so far, has been short lived, however, as it was almost immediately sold into by eager bears:Figure 1: BTC-USD, 4-Hour Candles, New HighOur current 4-hour candle is seeing a relatively easy retracement after days and days of an upward grind. дальше »
2019-3-9 02:08 | |
|
|
Bitcoin Price Watch: BTC Trend Overwhelmingly Bearish Below $3,760
Bitcoin price extended losses and traded below the $3,720 and $3,700 supports against the US Dollar. The price traded as low as $3,671 and it is currently consolidating above the $3,700 level. There is a crucial bearish trend line formed with resistance at $3,775 on the hourly chart of the BTC/USD pair (data feed from. дальше »
2019-3-5 09:38 | |
|
|
Bitcoin Price Analysis: Short-Term Support Breaks on High Volume and Spread
Leading into the London open, bitcoin broke through its local support level in a move that seems to be hinting toward a downward continuation:Figure 1: BTC-USD, Daily Candles, Broken Local SupportSo far, our daily candle has yet to close, but it is currently on schedule to close below local support. дальше »
2019-3-5 02:43 | |
|
|
EOS Daily Price Forecast – March 4
Today, the crypto’s price is below the EMAs which indicates that price is likely to fall. On the upside, a price breakout will result in the crypto reaching a high of $4. On the downside, a price breakdown will result in the crypto falling to a low of $2. дальше »
2019-3-4 09:34 | |
|
|
Bitcoin Price Analysis: Keep an Eye Out for a Close Above the Current High
Shortly after falling from its test of the low $4,000s, bitcoin managed to find support in the mid $3,500s. This has proven to be a relevant level over the last few months, and finding support here would be a sign of relatively strong demand:Figure 1: BTC-USD, Daily Candles, Local SupportThe high candle spread rejection following our test of the low $4,000s was an indication that we had strong levels of supply left in the market, but for the time being we are holding support. дальше »
2019-3-1 03:44 | |
|
|
Bitcoin Price Watch: BTC Could Rally Above $4,000 If It Breaks $3,900
Bitcoin price declined sharply below the $3,750 support and tested $3,650 against the US Dollar. The price bounced back from the $3,653 low and broke the key $3,750 resistance. There was a break above a major bearish trend line with resistance at $3,785 on the hourly chart of the BTC/USD pair (data feed from Kraken). дальше »
2019-2-28 09:30 | |
|
|
Ethereum (ETH) Daily Price Forecast – February 27
The ETH price is still continuing its range bound movement at the $139.55 price level. If the bears break below the previous low, the crypto will fall and find support above the $120 price level. ETH/USD Medium-term Trend: Ranging Resistance Levels: $240, $250, $260 Support Levels: $140, $130, $120 Yesterday, February 26, the price of […] дальше »
2019-2-27 09:48 | |
|
|
Bitcoin Price Analysis: Bullish Rejection Wipes Out Bitcoin’s Weekend Gains
Over the weekend, a strong rally was stifled by an even stronger rejection as the bitcoin market was shoved into a band of overhanging resistance. This band of resistance has been mentioned several times in our analyses over the last few weeks as it has proven impossible to overcome for the time being:Figure 1: BTC-USD, Daily Candles, Failed BreakoutThis run to the low $4,000s coincided with a breakout of a rather large symmetrical triangle consolidation shown above. дальше »
2019-2-26 02:42 | |
|
|
EOS Daily Price Forecast – February 25
The price of EOS is trading at $3. 70 as at the time of writing. If the bears break below the $3. 60 price level, the crypto will fall to a low of $2. 85. EOS/USD Medium-term Trend: Bullish Resistance levels: $ 6, $7, $8. дальше »
2019-2-25 09:51 | |
|
|
Litecoin (LTC) Daily Price Forecast – February 25
On February 24, the crypto’s price reached a high of $54.80. The bears broke below the 12-day EMA and the 26-day EMA as the crypto reached the low of $45.50. LTC/USD Medium-term Trend: Bullish Resistance Levels: $66, $68, $70 Support Levels: $40, $38, $36 Last week the price of Litecoin was in a bullish trend […] дальше »
2019-2-25 08:55 | |
|
|
Ethereum (ETH) Daily Price Forecast – February 25
On February 16, the ETH price traded at a low of $124.89 but rose to a high of $170. If the bears break below the $140 price level, the crypto’s price is likely to fall to the low of $124.68. ETH/USD Medium-term Trend: Bearish Resistance Levels: $240, $250, $260 Support Levels: $140, $130, $120 Last […] дальше »
2019-2-25 08:18 | |
|
|
Bitcoin (BTC) Daily Price Forecast – February 25
The BTC price was resisted at the $4,266. 60 price level and it fell to the low of $3,869. 50. If the bears break below the $3,800 price level, the crypto’s price will find support at either $3,600 and $3,700. дальше »
2019-2-25 07:21 | |
|
|
Bitcoin Price Plunge to $3,700 Expected, Say Traders; Retreat is a Blessing For Crypto
Following a rapid surge in the Bitcoin price from $3,614 to $4,000 within a span of three days, traders are expecting BTC to retrace by around 7 percent to $3,700. The cautious projection on the price trend of the dominant crypto asset comes after the failure of BTC to climb beyond the crucial $4,000 resistance level. дальше »
2019-2-23 11:55 | |
|
|
Is BitTorrent (BTT) Success Capping Tron (TRX) Demand?
Tron prices slow down as TRX slip to ninth BitTorrent (BTT) could be capping TRX demand Transactional volumes are low and well below 42 million of Feb 4 Even with low volumes, we retain a bullish outlook on Tron (TRX). дальше »
2019-2-22 22:00 | |
|
|
Bitcoin to Secure First Positive Month Since July 2018, When Will Stalemate Break?
For the first time since July 2018, Bitcoin (BTC) is on track to record its first green monthly candle, recording a positive month, According to cryptocurrency trader Josh Rager, if the Bitcoin price remains above the $3,414 mark by the end of February, BTC will establish a green monthly candle. дальше »
2019-2-17 12:25 | |
|
|
Bitcoin Price Analysis: After Sudden Upswing, Bitcoin Price Drifts Downward
Last week, we saw a violent move to the upside as bitcoin rallied 11% over the course of one day. Since peaking in the upper $3,600s, bitcoin has seen close to zero bullish follow-through, and the price has begun to drift downward over the course of the last week:Figure 1: BTC-USD, Hourly Candles, Downward DriftDownward-drifting markets like this can often be a sign that distribution is taking place. дальше »
2019-2-15 00:21 | |
|
|

Report: Crypto Exchanges Saw Trading Volumes Plummet in January
The crypto winter that started toward the end of last year doesn’t appear to be showing signs of slowing down. Digital assets like bitcoin lost more than 80 percent of their value while the overall crypto market cap shrunk from over $600 billion in January 2018 to less than $138 billion in December 2018. дальше »
2019-2-15 20:17 | |
|
|