Новости о Above Weekly [ Фото новости ] [ Свежие новости ] | |


Bitcoin Price Analysis: Yearly Support Breaks as Bitcoin Tests Underlying Demand
After months and months of consolidation, the yearly support finally broke and now bitcoin has found itself in the lower $5000s for the first time since 2017:Figure 1: BTC-USD, Daily Candles, Broken SupportBitcoin managed to drop a staggering 16% yesterday as the market sliced through the long held support like a knife through butter. дальше »
2018-11-16 01:28 | |
|
|
Bitcoin Price Watch: BTC/USD Targets Fresh Weekly Lows
Key Points Bitcoin price declined recently below the $6,300 support before correcting higher against the US Dollar. There was a break above a connecting bearish trend line with resistance at $6,360 on the hourly chart of the BTC/USD pair (data feed from Kraken). дальше »
2018-11-12 12:28 | |
|
|
Ethereum Price Weekly Analysis: ETH/USD Could Bounce Back To $220
Key Highlights ETH price corrected lower sharply after trading above the $222 level against the US Dollar. There is a key bullish trend line in place with support at $208 on the 4-hours chart of ETH/USD (data feed via Kraken). дальше »
2018-11-11 09:28 | |
|
|
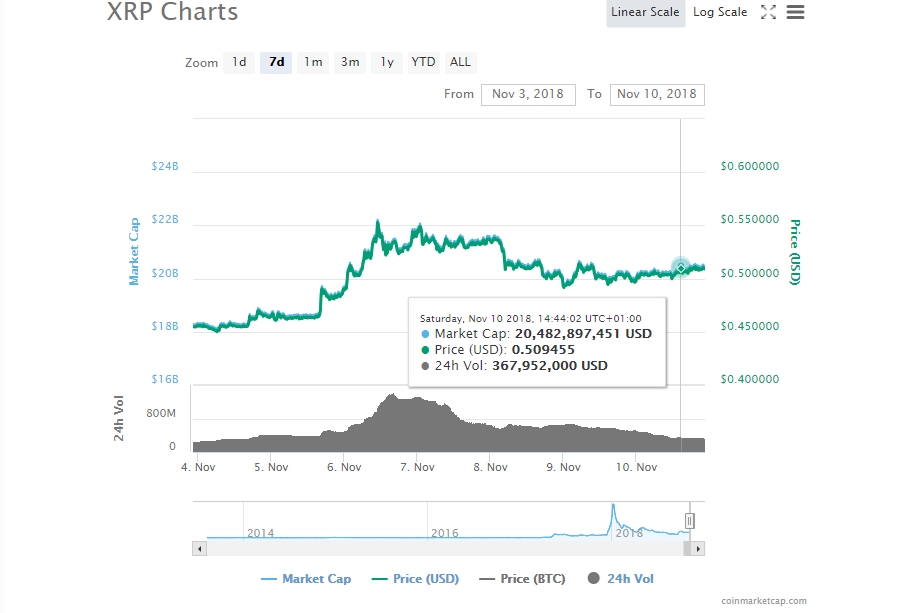
Ripple’s XRP Maintaining Position Above $0.5000 Against USD – Nasdaq
A similar market sentiment has taken over almost all leading crypto-coins prices for the past few days. With sellers having their saying on the 8th of November, values returned lower after a noticeable bull-run but the weekly end-result is by no doubt positive as digital assets have taken position on a higher trading ground. дальше »
2018-11-11 01:26 | |
|
|
Bitcoin Cash Price Weekly Analysis: BCH/USD Could Extend Gains Above $500
Key Points Bitcoin cash price rallied recently and broke the $450 and $460 resistances against the US Dollar. There was a break above a major bearish trend line with resistance at $430 on the 4-hours chart of the BCH/USD pair (data feed from Kraken). дальше »
2018-11-4 07:28 | |
|
|
Bitcoin Price Analysis: Weekly Consolidation Hints Toward Sustained Breakout
Another week has passed as bitcoin continues to coil in a tighter and tighter consolidation. Both price and volume continue to consolidate as bitcoin decides where the next major move will be. дальше »
2018-10-31 00:19 | |
|
|
Ethereum Price Weekly Analysis: ETH/USD Facing Significant Hurdle
Key Highlights ETH price stayed above the $196-197 support area with positive moves against the US Dollar. There is a monster breakout pattern formed with resistance at $204 on the 4-hours chart of ETH/USD (data feed via Kraken). дальше »
2018-10-28 09:28 | |
|
|
Bitcoin Price Weekly Analysis: BTC/USD Above $6,500 Could Accelerate Gains
Key Points Bitcoin price declined recently and tested the $6,350 support level against the US Dollar. There was a break above a connecting bearish trend line with resistance at $6,410 on the 4-hours chart of the BTC/USD pair (data feed from Kraken). дальше »
2018-10-21 11:00 | |
|
|
Bitcoin Cash Price Weekly Analysis: BCH/USD Primed for More Upsides
Key Points Bitcoin cash price declined sharply, but it found support near the $420 level against the US Dollar. There was a break above a major bearish trend line with resistance at $435 on the 4-hours chart of the BCH/USD pair (data feed from Kraken). дальше »
2018-10-21 07:28 | |
|
|
Bitcoin Price Analysis: Bitcoin Consolidation Forecasts $3,500 Move
A strong round of buys hit the market this weekend as unsubstantiated rumors began to circle surrounding Tether and Bitfinex’s potential insolvency. I won’t be going into the details surrounding the allegations because, like I said, they are nothing more than unsubstantiated rumors. дальше »
2018-10-17 01:03 | |
|
|
Ripple (XRP) Remains Undeterred By Bitcoin (BTC) Uncertainty
Ripple (XRP) seems to be undeterred by Bitcoin (BTC)’s uncertain moves. It did fall yesterday like the rest of the market. However, it was very keen on reversing those losses today. The above chart for XRP/USD on the daily time frame shows Ripple (XRP) in a clear ascending channel. дальше »
2018-10-13 00:30 | |
|
|
Ethereum Classic (ETC) Can Easily End The Year Above $100
Ethereum Classic (ETC) is highly likely to trade north of $100 by end of the year. This does not require a very bullish Bitcoin (BTC). In fact, if Bitcoin (BTC) trades around $10,000, that would do the job for Ethereum Classic (ETC). дальше »
2018-10-12 17:30 | |
|
|

Bitcoin, Ether, XRP Weekly Market Update: October 11, 2018
Bitcoin managed to hold its ground and defend the $6,500 level on October 4, 2018, closing the day with a $90 gain. BTC then moved above $6,600 on October 5 and stopped at $6,640 – its second green day in a row. дальше »
2018-10-12 23:00 | |
|
|
Eos (EOS) Investors Unmoved By Bitcoin (BTC) Selloff
Chart for EOS/USD (1W) Cryptocurrency markets plunge deep in the red, dancing to the tune of Bitcoin (BTC). Eos (EOS) investors are not moved by this confusion. In fact, as the above weekly chart for EOS/USD shows, the price of Eos (EOS) has not corrected the same way as the rest of the market. дальше »
2018-10-11 00:30 | |
|
|
Cardano (ADA) Could Moonshot After Coinbase Listing
Chart for ADA/USD (1W) Cardano (ADA) is the cryptocurrency with the highest probability of being listed next on Coinbase. Cardano (ADA), which is supported by IOHK, is the firm run by Charles Hoskinson, the founder of Cardano (ADA). дальше »
2018-10-10 18:30 | |
|
|
Bitcoin (BTC) May Never See $6,000 Again
Chart for BTC/USD (1W) Bitcoin (BTC) is finally out of the woods. The above weekly chart for BTC/USD shows that Bitcoin (BTC) has formed a weekly candle above the historical downtrend line. This is the first time since January 2018 that Bitcoin (BTC) has breached this resistance line and formed a candle above it. дальше »
2018-10-10 00:30 | |
|
|
Ripple (XRP) Defends 5 Week EMA Amid No Signs Of A Slow Down
Chart for XRP/BTC (1W) Ripple (XRP) has defended its 5 Week EMA. This is a clear message to all the critics out there calling Ripple (XRP)’s rally a pump and dump. RSI for the above weekly chart for XRP/BTC does seem to have neared the overbought range. дальше »
2018-10-9 18:30 | |
|
|
Bitcoin Price Weekly Analysis: BTC/USD Buyers Losing Momentum Above $6,600
Key Points Bitcoin price formed a decent support near the $6,400 level against the US Dollar. There was a break above a major bearish trend line with resistance at $6,540 on the 4-hours chart of the BTC/USD pair (data feed from Kraken). дальше »
2018-10-7 09:28 | |
|
|
Ethereum Price Weekly Analysis: ETH/USD Remains in Broad Range
Key Highlights ETH price is currently trading in a broad range above the $210 support against the US Dollar. There is an ascending channel formed with support at $222 on the 4-hours chart of ETH/USD (data feed via Kraken). дальше »
2018-10-7 07:28 | |
|
|
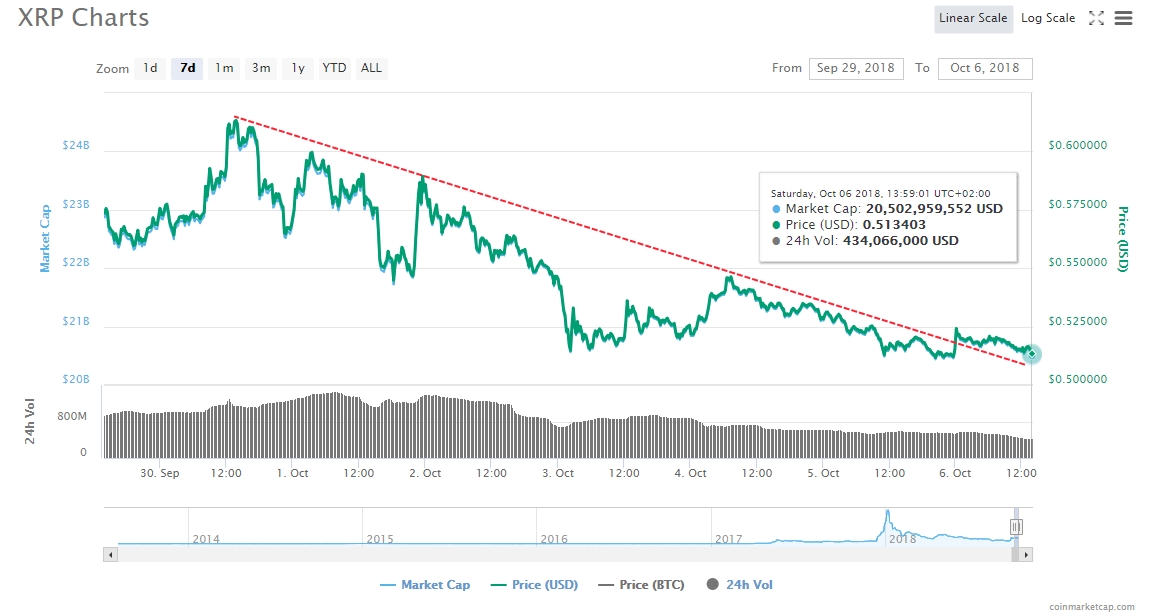
Ripple’s XRP Rise! Also Attempt to Stay Above $0.5000 as it Breaks Weekly Declining Trend
XRP Headline Stealer For the last few months, the third largest coin by market capitalization XRP and its team/firm backing it up Ripple[labs] have been taking center stage with no mercy for the other cryptocurrencies. дальше »
2018-10-7 15:48 | |
|
|
Bitcoin (BTC) Cannot Fall Below $5,800 Under The Bullish Case
Bitcoin (BTC) has to make a move by next week. The weekly chart for BTC/USD shows that Bitcoin (BTC) is about to close a weekly candle right next to the downtrend resistance. If this candle closes above the downtrend resistance, which is quite likely, we will see the beginning of a new cycle from next week. дальше »
2018-10-4 18:30 | |
|
|
Ether Price Analysis: Higher Lows Could Yield Retest of Local High
After two back-to-back weeks of record-setting volume, ether finds itself situated below historic resistance and currently unable to reach its downtrend line:Figure 1: ETH-USD, Weekly Candles, Downtrend and Record-Setting VolumeFor months, ether has been unable to break its downward trend. дальше »
2018-10-4 23:55 | |
|
|

In Search of Stability: An Overview of the Budding Stablecoin Ecosystem
Stability. The word seems to be at complete odds with the current nature of the crypto market. With its flagship coin having “died” on hundreds of occasions, volatility and meteoric price swings have come to define cryptocurrencies, as price stability, ever-elusive, is in short supply. дальше »
2018-10-3 19:05 | |
|
|
Ethereum Classic (ETC)’s Next Move Will Be Decisive
Ethereum Classic (ETC) like many other altcoins has completed its correction. It is down to Bitcoin (BTC) now to resume its uptrend so the rest of the market can follow. The above weekly chart for ETC/BTC shows that Ethereum Classic (ETC) has finally formed a bottom against Bitcoin (BTC). дальше »
2018-10-3 18:00 | |
|
|
Bitcoin Cash (BCH) Price Dominates: Latest News/Developments, Future Prediction
Mid-week and the crypto-verse market is taking a stride downside as prices are approaching supports just above important levels. Things are looking still pretty good on the weekly chart as Bitcoin [BTC], the largest by market capitalization, is still on the green with a few coins following. дальше »
2018-10-3 11:35 | |
|
|
Litecoin (LTC) All Set To Finally Break Downtrend
Litecoin (LTC) has never been this bullish in a long time. The above weekly chart for LTC/USD shows how persistently it bottomed out between August and October. In addition to that, Litecoin (LTC) has now found a solid support right next to its downtrend resistance. дальше »
2018-10-2 17:00 | |
|
|
Bitcoin Price Weekly Analysis: BTC/USD Remains in Uptrend Above $6,400
Key Points Bitcoin price failed to break the $6,800 resistance recently and declined against the US Dollar. There is a major bullish trend line in place with support at $6,400 on the 4-hours chart of the BTC/USD pair (data feed from Kraken). дальше »
2018-9-30 10:30 | |
|
|
Ethereum Price Weekly Analysis: ETH/USD Consolidating Above $225
Key Highlights ETH price made a nice upside move and traded above the $225 level against the US Dollar. There was a break above a major contracting triangle with resistance at $228 on the 4-hours chart of ETH/USD (data feed via Kraken). дальше »
2018-9-30 09:30 | |
|
|
Bitcoin Cash Price Weekly Analysis: BCH/USD Sighting Further Upsides
Key Points Bitcoin cash price gained traction and moved above the $500 barrier against the US Dollar. There is a key contracting triangle in place with support near $510 on the 4-hours chart of the BCH/USD pair (data feed from Kraken). дальше »
2018-9-30 07:28 | |
|
|
Bitcoin Price Watch: BTC/USD Targets New Weekly High
Key Points Bitcoin price surged higher and broke the $6,540-50 resistance area against the US Dollar. Yesterday’s highlighted important bearish trend line was breached with resistance at $6,495 on the hourly chart of the BTC/USD pair (data feed from Kraken). дальше »
2018-9-28 12:28 | |
|
|
Litecoin (LTC) Finally Forms A Strong Bottom, Prepares For Trend Reversal
Litecoin (LTC) appeared extremely weak when it fell below the 21 Week EMA. The decline was a very sharp and steady one. Debates over value proposition of Litecoin (LTC) began to surface and a lot of investors and analysts were convinced that Litecoin (LTC) might break market structure and fall significantly below $50. дальше »
2018-9-27 18:30 | |
|
|
Is Stellar (XLM) Finally Out Of The Woods?
Stellar (XLM) made an incredible 25% gain today. However, the price has quickly retraced back towards the downtrend resistance. Whether Stellar (XLM) closes the weekly candle below or above the downtrend resistance today will decide Stellar (XLM)’s direction for the weeks to come. дальше »
2018-9-23 23:00 | |
|
|
Ethereum Price Weekly Analysis: ETH/USD Uptrend Is Intact
Key Highlights ETH price is trading with a positive bias above the $220 level against the US Dollar. There is a major bullish trend line formed with support at $224 on the 4-hours chart of ETH/USD (data feed via Kraken). дальше »
2018-9-23 07:28 | |
|
|
Bitcoin, Ether, and XRP Weekly Market Update: September 21, 2018
BTC closed the day with a solid gain of more than $160 on September 13, touching the $6,500 level. Traders pushed the price even higher on September 14, but the biggest cryptocurrency could not keep the momentum and closed below the $6,500 mark (at $6,480). дальше »
2018-9-21 19:30 | |
|
|
Golem (GNT) Likely To Reach McAfee’s Price Target Of $5 By End Of Year
Golem (GNT) is up 7% for the day while the rest of the market bleeds. Normally, this would not be a big deal but the chart above for GNT/USD on the weekly time frame shows us exactly why it is a big deal this time. дальше »
2018-9-18 18:30 | |
|
|
Ripple (XRP) All Set To Lead Altcoin Rally By October
Ripple (XRP) is probably the most bullish looking coin right now. This is because Ripple (XRP) has already complete an almost 92% correction since its fall from $3. 31 in January this year. In addition to that, as the above weekly chart for XRP/USD shows, Ripple (XRP) has just completed a giant bullish gartley pattern that extends all the way to 2017. дальше »
2018-9-12 00:30 | |
|
|
Ethereum Classic (ETC) Vs. Ethereum (ETH): The True Flippening
Ethereum Classic (ETC) has been in a downtrend against Ethereum (ETH) ever since its inception. The weekly chart above for ETC/ETH shows that from the beginning of 2017 until the month of July this year, Ethereum Classic (ETC) had been trading in a falling wedge against Ethereum (ETH). дальше »
2018-9-11 17:00 | |
|
|

Dogecoin (DOGE) Not even Shook by the Weekly Market Performance: Story and Latest
Diving right into it, Dogecoin (DOGE/USD) did not obey the standard while in contrary gaining for the last week. As mentioned in the last Ethereum World New post related to the much-loved coin, going above the $0. дальше »
2018-9-10 15:51 | |
|
|
Ripple (XRP) Correction Might Finally Be Over As Price Finds Support At 200 Week EMA
Ripple (XRP) has finally found support above the 200 week EMA as shown by the XRP/BTC weekly chart above. This might seem trivial considering Ripple (XRP) has broken a serious of EMAs during the past few months without putting up a fight. дальше »
2018-9-7 00:24 | |
|
|
Cardano (ADA) Loses 95% Of Its Value Since January ATH, Further Downside Unlikely
Cardano (ADA) has now lost 95% of its value since its all time high of January. The above weekly chart for ADA/BTC shows that Cardano (ADA) which until now has been trading in a pitchfork as well as a falling wedge is now at the end of its correction. дальше »
2018-9-6 18:30 | |
|
|
Stellar (XLM) Awaits Breakout As Price Fails Again To Breach Resistance
Stellar (XLM) seems to be at a stage where it is just waiting for the rest of the market to recover. The weekly chart above for XLM/USD shows that the price has already closed four candles below the 21 Week EMA and could now close the fifth candle below the 21 EMA as well. дальше »
2018-9-6 00:30 | |
|
|
Bitcoin (BTC) Faces Rejection At 21 Week EMA, But Finds Strong Support At 21-Day EMA
Bitcoin (BTC) is an interesting point. The price has just found a strong resistance at the 21 Week EMA shown on the BTC/USD weekly chart above, but it has also found a strong support at the 21 Day EMA. дальше »
2018-9-5 18:30 | |
|
|
Bitcoin Price Indicator Turns Bullish for First Time in 8 Months
Bitcoin's weekly MACD indicator has risen above zero for the first time since January, confirming a long-term bearish-to-bullish trend change. дальше »
2018-9-5 14:05 | |
|
|
Bitcoin Indicator Turns Bullish for First Time in 8 Months
Bitcoin's weekly MACD indicator has risen above zero for the first time since January, confirming a long-term bearish-to-bullish trend change. дальше »
2018-9-4 14:05 | |
|
|
Litecoin Price Analysis: LTC/USD Targets Fresh Weekly Highs
Litecoin price remained nicely supported above the $64. 50 level against the US Dollar. LTC/USD is likely to extend gains above the recent high at $67. 50 in the near term. Key Talking Points Litecoin price dipped recently, but it found a decent support near $64. дальше »
2018-9-4 08:39 | |
|
|
Ripple (XRP) Is About To Begin A New Cycle, But Can It Make Similar Gains?
Ripple (XRP) is about to begin a new trend. The weekly chart for XRP/USD shows that this could be as soon as next week when Ripple (XRP) forms a new candle outside the bullish gartley formation on the XRP/USD chart. дальше »
2018-9-3 00:30 | |
|
|
Bitcoin Price Weekly Analysis: BTC/USD Targets $7,300-7,400
Key Points Bitcoin price is moving higher nicely and it could soon test the $7. 300 level against the US Dollar. There is a major bullish trend line formed with support at $7,050 on the 4-hours chart of the BTC/USD pair (data feed from Kraken). дальше »
2018-9-2 09:00 | |
|
|