Новости о 500 Chart [ Фото новости ] [ Свежие новости ] | |


This Bitcoin price chart should cheer all of BTC bulls
Bitcoin (BTC) price has remained in a holding pattern in the past two weeks as it continued to underperform American equities, which had their best week in over nine months. Bitcoin has been stuck between the support at $57,000 and the resistance point at $62,000 while the Dow Jones, Nasdaq 100, and S&P 500 indices […] дальше »
2024-8-17 17:05 | |
|
|
Bitcoin Finds Major Relief After 10 Years: Is The US Government Now The Biggest Threat?
Bitcoin is shaky at spot rates, looking at the formation in the daily chart. The leg-up to spot rates meant the world’s most valuable coin shot by roughly 30%, rising from the pits of $53,500 to around $70,000 over the weekend. дальше »
2024-7-31 06:00 | |
|
|
Why is crypto rising today? And why do I think it could be short-lived?
I almost forgot what it was like to see a big green candle on a cryptocurrency chart. Today, however, that is exactly what we have, as magic Internet money is climbing sharply upward. Bitcoin is now trading at $20,600, above the psychologically important number of $20,000, while Ethereum has climbed north of $1,500 for the […] The post Why is crypto rising today? And why do I think it could be short-lived? appeared first on CoinJournal. дальше »
2022-10-26 13:57 | |
|
|

Why this is an ideal time to buy Binance Coin
Binance coin's price chart shows that a trend has emerged and the altcoin may be consolidating. The price has dropped to the $485 level and below the $500 level, Binance coin is undervalued based on tThe post Why this is an ideal time to buy Binance Coin appeared first on AMBCrypto. дальше »
2021-4-19 21:00 | |
|
|
What Changed in Crypto Markets While You Were Sleeping — April 2
Bitcoin Update The daily chart shows that BTC has been increasing since March 25. Yesterday, it briefly broke $60,000 before retracing slightly. However, BTC has yet to reach a close above the $59,500 resistance area. дальше »
2021-4-2 10:56 | |
|
|
Bitcoin (BTC) Breaks Out Above $60,000 but Fails to Sustain Highs
Bitcoin is expected to validate the $59,500 area as support and gradually increase towards a new all-time high. Bitcoin Reaches $60,000 The daily chart shows that BTC has been increasing since March 25. дальше »
2021-4-2 10:39 | |
|
|
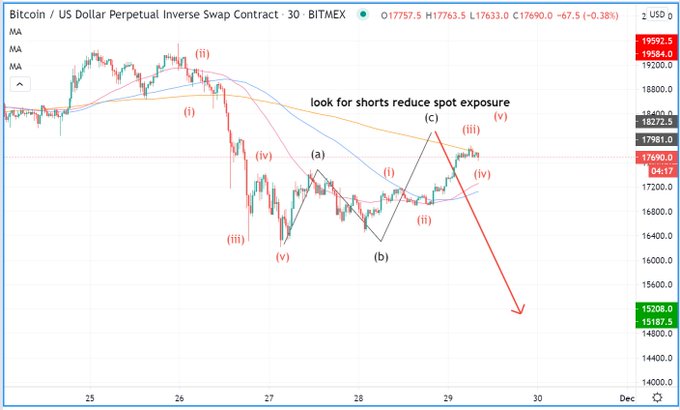
Analyst Who Predicted Bitcoin’s 2018 Lows Says Another Drop Is Likely
Bitcoin has undergone a strong drop since the highs of $19,500 seen last week A historically accurate analyst says that further losses are likely for the cryptocurrency The analyst shared a chart showing that Bitcoin is likely in the midst of trading in a dead cat bounce prior to further losses He cited the Elliot Wave form of technical analysis, which predicts that markets move in predictable waves. дальше »
2020-11-29 02:59 | |
|
|
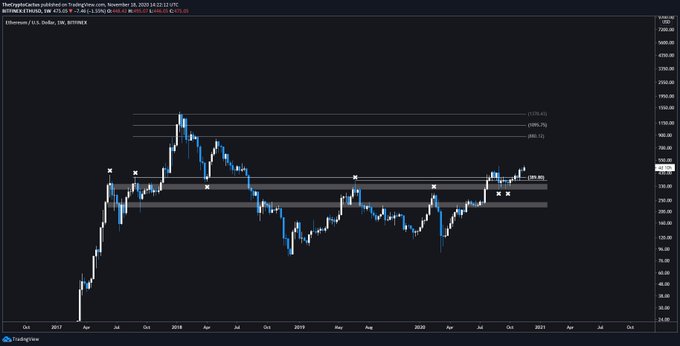
Analysts Still Expect Ethereum Rally to $500 Despite $40 Flash Drop
Analysts think that Ethereum is primed to press higher despite last night’s $40 drop. One analyst noted that Ethereum remains in an extremely advantageous position on a macro time frame. He shared a chart showing that ETH is currently sitting above macro supports, meaning it has room to stretch toward $800 and beyond as it continues to hold those technical levels. дальше »
2020-11-19 15:00 | |
|
|

Numerous On-Chain Metrics Turn In Favor Of Ethereum – $500 Next?
Ethereum price is currently $367 after establishing a renewed uptrend on the daily chart. The smart-contracts pioneer remains rank 2 by market capitalization with $41 billion and has experienced a notable rise in trading volume since July 1. дальше »
2020-10-18 21:39 | |
|
|
Bitcoin Fractals That Sent Price 30-50% Higher Flash Again
Just a day before Bitcoin breached $11,500, a psychological resistance level, the cryptocurrency painted one of the strongest bullish signals of its eleven-year history as a financial asset. On October 11, BTC/USD formed a leading ‘Golden Cross‘ on its daily chart. дальше »
2020-10-15 16:00 | |
|
|
Three Key Reasons Why Bitcoin’s Macro Chart Is Still Bullish
Bitcoin has undergone a strong rally over recent months from the March lows to $12,500 at the August highs. Not everyone is convinced that the crypto’s macro trend is positive, though. They point to the fact that Bitcoin has yet to firmly establish itself above $11,500 and $12,000. дальше »
2020-10-13 02:59 | |
|
|
A Bearish Reversal in Stock Market May Bleed Bitcoin: Analyst
Bitcoin remains at the risk of losing a part of its yearly gains on a negative stock market sentiment, according to Kevin Svenson. The chart analyst highlighted the S&P 500’s three-day rout this week, adding that if it becomes a “confirmed reversal,” then it would take Bitcoin–and the rest of the cryptocurrency market–lower in tandem. дальше »
2020-9-11 09:54 | |
|
|
Ethereum Aims to Increase Towards $600
The Ethereum (ETH) price has broken out from a long-term resistance level and validated it as support. As long as it’s trading above here, the trend remains bullish. Breakout From Long-Term Range Cryptocurrency trader @CryptoMichNL outlined an Ethereum chart, stating that if the current level holds, ETH could rally all the way to $500. дальше »
2020-9-1 21:38 | |
|
|
The Winklevoss Twins think Bitcoin will hit $500,000 over a long period of time
By most analysts’ interpretations of the Bitcoin price chart, the cryptocurrency market is in the early innings of another bull trend. The post The Winklevoss Twins think Bitcoin will hit $500,000 over a long period of time appeared first on CryptoSlate. дальше »
2020-8-31 02:00 | |
|
|
Daily Chart Suggests Bitcoin At Risk of Extended Correction To $10,500
Bitcoin struggled to clear the $12,000 resistance zone and corrected lower against the US Dollar. BTC’s daily chart suggests the price could extend its decline towards the $10,500 support. Bitcoin topped near the $12,080 level and it is currently correcting gains. дальше »
2020-8-12 06:58 | |
|
|

Gold Is Booming — and That Means Bitcoin Could Soon Break $10,000
While markets like Bitcoin and the S&P 500 have flatlined over recent weeks, gold has rocketed higher. As can be seen in the chart below, the precious metal has exhibited strength since a dip to $1,670 in June. дальше »
2020-7-11 13:00 | |
|
|

Bitcoin’s Chart Is Looking More and More Like February’s $10,500 Top
There’s no doubt that Bitcoin’s price action has been weird over recent weeks. As the S&P 500 has entered a range, so too has the cryptocurrency. In the past week, BTC has literally traded in a 5% range. дальше »
2020-7-5 01:00 | |
|
|
If the S&P 500 Passes 3,200, Then Bitcoin Can Retake $9,500: Analyst
If you’ve followed Bitcoin analysts over recent weeks, you likely know of the importance of $9,500 to the cryptocurrency. As the chart below indicates, $9,500 has been a crucial price point for Bitcoin over the past two months. дальше »
2020-7-3 04:00 | |
|
|

Bitcoin Following Scarily Similar S&P 500 Fractal Would Set New All-Time High By Late 2020
A shockingly similar fractal from the S&P 500 during the 2008 recession Bitcoin was born from is playing out across the cryptocurrency’s price chart. If the first-ever crypto asset continues to follow the same path as the SPX did back then, Bitcoin will set a new all-time high record before the end of 2020. S&P […] дальше »
2020-6-11 19:00 | |
|
|

3 Macro Factors Show Why Bitcoin Is Poised to Erupt Past $10,500: Analyst
The recent price action has made it easy for investors to flip bearish for Bitcoin for the time being, but a top analyst recently shared that he remains macro bullish on the cryptocurrency. Backing his optimism, he shared the chart below, along with three macro factors showing that Bitcoin is likely still embroiled in a macro uptrend. дальше »
2020-6-10 15:00 | |
|
|
With few blocks away from Halving, here’s how Bitcoin has been performing so far today
Today has been extremely volatile for Bitcoin breaking above $9,000 just to crash in the next few hours. We are seeing a 1% price move on 1-minute candlesticks all the time. However, even after such high volatility Bitcoin is still trading around $8,500, the midpoint between $9,200 and $8,000 basically. Looking at the 1-hour chart, […] дальше »
2020-5-12 22:00 | |
|
|
Bitcoin Primed To Test $10,500 as Bulls Take Over Crypto Market
Bitcoin is up more than 7% and it broke the $10,000 resistance against the US Dollar. BTC is showing many bullish signs on the daily chart and it is likely to test $10,500. Bitcoin is gaining bullish momentum and it recently spiked above $10,000. дальше »
2020-5-8 06:28 | |
|
|
Analyst: If I Look at Bitcoin’s Chart “Without Bias,” a Sub-$1,000 BTC Is Possible
Bitcoin has undoubtedly been hit hard over the past few days; after peaking at $9,200 on Saturday, the cryptocurrency has fallen off a cliff, plunging as low as $5,500 just today. This marks a strong reversal from the 50% rally BTC saw from December to the middle of February, which many hoped was a precursor... дальше »
2020-3-13 03:00 | |
|
|

Bitcoin’s 10% Flash Crash May Actually Satisfy This Bullish Chart Pattern
Bitcoin didn’t fare too well on Wednesday. After recovering to $10,300 from the weekend’s low of $9,500 — a gain of just over 8% — the price of the leading cryptocurrency fell off a cliff as the day came to a close on Wednesday. дальше »
2020-2-20 12:11 | |
|
|
Bitcoin Daily Golden Cross Forms, Bull Market Has Officially Arrived
Bitcoin (BTC) just added another huge factor to the bullish case, as a golden cross of the 50-day and 200-day moving average appears on the daily chart. Bitcoin 50-Day MA Crossed Over, Sparking Expectations of Big Rally Bitcoin prices managed to bounce quickly from a dip close to the $9,500 level. дальше »
2020-2-18 17:00 | |
|
|

Why Bitcoin Price Could Hit $100,000 in 2021?
The month of January is usually bearish for bitcoin price but this one has bucked that trend. It has been the best start to the year since 2012 but analysts are eyeing even greater gains in 2021. A dump down to $8,500 a few hours ago was responded to rapidly as the following candle on the hourly chart was larger and green. дальше »
2020-1-22 16:00 | |
|
|
Bitcoin, Ethereum, and XRP Lead Market Rally
A massive capital inflow triggered a rally felt through the entire market. Now, led by Bitcoin, Ethereum, and XRP the market seems prepared to enter another bull run. Bitcoin Outlook After $8,500 Based on the 1-week chart, several technical indicators reveal that Bitcoin is extremely bullish. дальше »
2020-1-15 00:06 | |
|
|
Bitcoin Daily Chart Indicates It Is Going Parabolic To $9K and $10K
Bitcoin broke a couple of important hurdles near $7,500 and $8,000 on the daily chart against the US Dollar. BTC price action indicates a strong rise towards $9,100 or even $10,000. Bitcoin price surged $500 and settled above the key $8,000 resistance against the US Dollar. дальше »
2020-1-8 09:00 | |
|
|
Bitcoin Rally Pauses But Not Likely Over, Bulls Aim $8K
Bitcoin price rallied recently above $7,300 before it ran into $7,500 against the US Dollar. The price is showing positive signs it seems like the bulls aim another test of $7,500. There is a major bullish trend line forming with support near $7,325 on the hourly chart of the BTC/USD pair (data feed from Kraken).... The post appeared first on NewsBTC. дальше »
2019-12-30 09:04 | |
|
|
Bitcoin Trading Near Make-or-Break Levels, 100 SMA Holds Key
Bitcoin price failed to extend gains above $7,700 and declined more than $400 against the US Dollar. The price is now trading below $7,400 and it declined close to the $7,260 support area. Earlier, there was a break below a contacting triangle with support near $7,500 on the hourly chart of the BTC/USD pair (data. дальше »
2019-12-24 09:00 | |
|
|
Bitcoin Rallies 5% To Clear Hurdles, Bulls Aiming $8K
Bitcoin price rallied more than 5% to clear the $7,500 resistance against the US Dollar. The price is now trading in a positive zone and it could rise further above $7,700. There is a short term breakout pattern forming with resistance near $7,590 on the hourly chart of the BTC/USD pair (data feed from Kraken). дальше »
2019-12-23 09:00 | |
|
|
Bitcoin (BTC) Above $7,500 Would Make Case for Larger Rally
Bitcoin price reversed its losses and settled above $7,000 against the US Dollar. The price rallied close to the $7,500 resistance area, where sellers emerged. Earlier, there was a break above a key bearish trend line with resistance near $6,700 on the hourly chart of the BTC/USD pair (data feed from Kraken). дальше »
2019-12-19 09:00 | |
|
|
Bitcoin (BTC) Bears Remain In Driver’s Seat But Bulls Not Done Yet
Bitcoin price is extending losses below the $6,800 support area against the US Dollar. A crucial support is waiting on the downside near $6,500 and $6,200. There is a new connecting bearish trend line forming with resistance near $6,740 on the hourly chart of the BTC/USD pair (data feed from Kraken). дальше »
2019-12-18 09:00 | |
|
|
Bitcoin Breakdown Looks Real, $6.2K On The Horizon?
Bitcoin price is down around 4% and it broke the key $7,000 support against the US Dollar. The price is likely to continue lower towards $6,500 or $6,200 in the near term. There is a short term contracting triangle forming with resistance near $6,880 on the hourly chart of the BTC/USD pair (data feed from. дальше »
2019-12-17 09:00 | |
|
|
Bitcoin Price Still Has Potential to Dive to $5,500, Yet Macro Uptrend Still Intact
Last week, the one-week Bitcoin chart printed an extremely bullish sign: the golden cross of the 50-week and 100-week simple moving averages, with the former crossing above the latter. (As an aside, a golden cross is when a short-term moving average crosses over a long-term one to imply bulls have control. дальше »
2019-12-15 09:18 | |
|
|
Bitcoin Weekly Forecast: BTC Won’t Go Quietly, Risk of Bounce Grows
After forming a base above $7,000, bitcoin price climbed above the $7,500 resistance against the US Dollar. The price is currently correcting gains and it is trading below the $7,440 level. There is a major contracting triangle forming with resistance near $7,520 on the 4-hours chart of the BTC/USD pair (data feed from Kraken). дальше »
2019-12-8 08:00 | |
|
|
Bitcoin (BTC) Price Weekly Forecast: Risk Of Fresh Drop To $10,500
After a decent rise, bitcoin price topped near the $12,325 level against the US Dollar. The price is currently correcting lower below $11,500, with a bearish angle. There was a break below a crucial contracting triangle with support near $11,750 on the 4-hours chart of the BTC/USD pair (data feed from Kraken). дальше »
2019-8-12 09:28 | |
|
|
Bitcoin (BTC) Price Approaching Next Crucial Break: $11,500 Holds Key
Bitcoin price is still struggling to gain bullish momentum above the $12,000 resistance against the US Dollar. The price is likely setting up for the next break either above $12,000 or towards $11,500. дальше »
2019-8-10 07:08 | |
|
|
Bitcoin Price (BTC/USD) Could Hit $12.2K Amid Strong Technical Bias
Bitcoin price extended gains above the $11,500 and $11,700 resistances against the US Dollar. The price is currently correcting lower after trading close to the $12,000 resistance. There is a connecting bullish trend line forming with support near $11,540 on the hourly chart of the BTC/USD pair (data feed from Kraken). дальше »
2019-8-6 09:00 | |
|
|

Bitcoin Price Analysis: BTC FOMO Could Surpass $12.4K This Week
In my previous analysis, we looked at the strength of the new Bitcoin uptrend as price levels traded just below $11,000 resistance. Since then, bulls have been well in control resulting in further upside towards $12,000. дальше »
2019-8-6 20:02 | |
|
|
Bitcoin Price Hits $11.5K Target: BTC Up 8%, Dips Well Supported
Bitcoin price rallied more than 8% and climbed towards $11,500 against the US Dollar. The price traded as high as $11,646 and it is currently correcting gains. There is a key bullish trend line forming with support near $10,900 on the hourly chart of the BTC/USD pair (data feed from Kraken). дальше »
2019-8-5 09:00 | |
|
|