2019-6-6 04:20 |
4H HOTBTC
Holochain did good to our forecast of May 18th – it broke the 23 sats resistance, flown all up to 29 sats and then corrected to the 24 sats and bounced back up to 31 before settling at the current 27 sats.
On the 4 hour timeframe, HOT suffered a healthy pullback, failed to keep Fib50 of ABC Fib extension at 27 sats and even fell all the way down to 23 sats before bouncing back up to the current 25 sats. Breakout level is still the 31 sats zone, sturdy resistance level.
Breakdown level for Holochain is at 23 sats, a Fib50 and previous support. If it falls below, it could sink to the local bottom of 15 sats again.
Consolidation and sideways for couple of candles in this area would be good for HOT, before it can swoop up again in an effort to break the 30-33 sats zone. Trend based Fib extension (black colors) projects HOT to reach 33 sats in the next swing, provided this correction finds its floor above 25 sats height and the blue uptrend line (see chart below). Next target after that would be the 41 sats area, old resistance level from February this year.
Daily HOTBTC
All moving averages are huddled in a tight space, aligned in a mixed order. The longer MA50 and MA200 are still in bullish trend, and the shorter EMA20 has made a bullish cross with both of the 50 and 200 MA.
The daily chart Fib confirms the importance of the 22-23 sats area, where we see confluence of Fib level 50 with all moving averages. Since the blue uptrend line got broken, the 22-23 sats zone was the defense line for HOT and it stood its ground. The price is now trying to break up again above the ascending trendline.
One thing to bear in mind is the turbulent and erratic nature of bitcoin – a sudden thrust up or slide down is always on the cards which would invalidate this and all other analysis and predictions. In such cases, market is shaken up with most traders exiting altcoins and entering bitcoin positions or seeking shelter in stablecoins, especially in the initial phases of bitcoin pumps and dumps. So it is always a good idea to keep a close eye on bitcoin’s behaviour before opening a long or a short on any other coin in the market.
Should this happen, stop by again to check out our updated charts and thoughts.
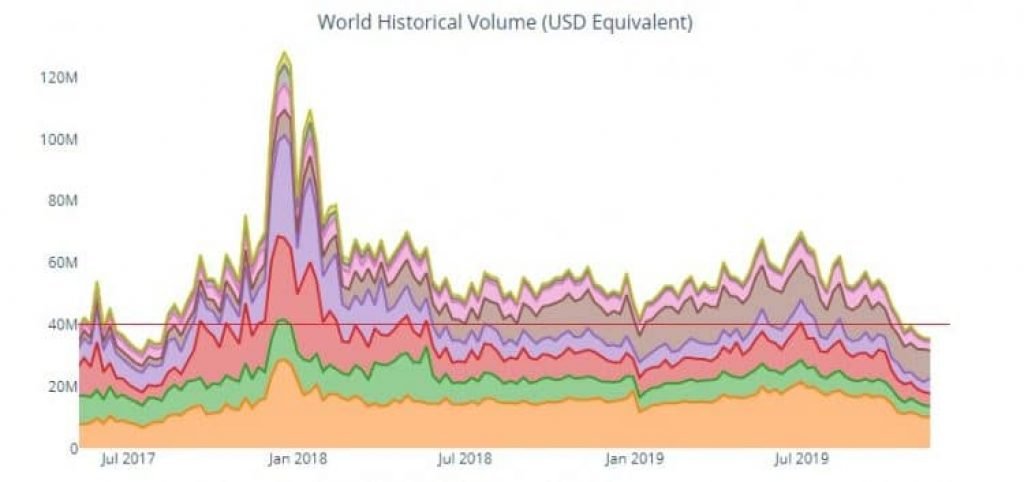
Trading volume is relatively low – reported volume in the last 24hrs is $12.7m (the strongest volume day in April for HOT was April 18th with $26.5m) and “Real 10” (trading volume on the exchanges that provably prevent wash trading) volume is 5.4x lower – $2.3m. This means that HOT liquidity is only moderately inflated and its trading volume is overstated by 3x which is comparatively great ratio.
On the other side, HOT has a strong buy support, according to coinmarketbook.cc. Buy support is measuring sum of buy orders at 10% distance from the highest bid price. This way we can eliminate fake buy walls and whale manipulation and see the real interest of the market in a certain coin. In the last 24 hours, HOT had a $1.8m of buy orders measured with this method, which sets HOT buy support/market cap ratio at 1.05%, a wide-market above average value. Bitcoin and Ethereum had a 0.27% and 0.28% ratios, respectively. This novel metric indicates there are a lot of manipulations, inflated liquidity and fake orders on all crypto trading pairs, including HOT pairs.
Update: FundamentalsTo assess fundamental health of a project, we used the FCAS metric. FCAS is a comparative metric whose score is derived from the interactivity between primary project lifecycle fundamentals: User Activity, Developer Behavior, and Market Maturity.
There are a few sub components which provide data to each fundamental:
User Activity is comprised of Project Utilization and Network Activity
Developer Behavior is comprised of Code Changes, Code Improvement and Community Involvement
Market Maturity is comprised of Liquidity and Market Risk. Market Maturity has less than 5% impact on a project’s overall FCAS.
FCAS ratings are on a 0-1000 point scale with a corresponding letter grade. Break points are based on standard deviations in the underlying component distributions.
900 – 1000 is marked as S for superb. 750 – 899 is marked as A for attractive. 650 – 749 is marked as B for basic. 500 – 649 is marked as C for caution. And finally, below 500 is marked as fragile. You can read more about it here.
Holochain has been ranked as the A category – attractive with overall 777 points as of May 3rd. By far the strongest metric that contributed to this great score is developer activity that got 937 points, followed by user activity with 680 and market maturity that had only 229 points.
Below are some of the most important news around the project in the last 30 days.
Holo host has come out with an updated roadmap that you can see here.The team has issued another edition of their medium updates – see more about it here.In their regular updates, Holochain covers everything pertinent to the project and ecosystem. Most significant news are Holoports that are currently deep in the production line. Everything is now in place for the assemble process of Initial HoloPorts. Holochain team will be receiving the first ones for the internal stages of Closed Alpha Testing very soon.As for the technical updates, the focus was largely on cryptography. More and more of the long-term work providing cryptographic support to applications is stable and being incorporated into the official releases. They’ve also started the important work of perfecting performance profiling and tuning.
The post Holochain (HOT) Price Analysis and Short-Term Prediction: Hovering Around Old Supports and Resistances appeared first on CaptainAltcoin.
origin »Bitcoin price in Telegram @btc_price_every_hour
UpToken (UP) на Currencies.ru
|
|


