Glassnode: Bitcoin accumulation reaches 3-month high

2024-7-12 12:05

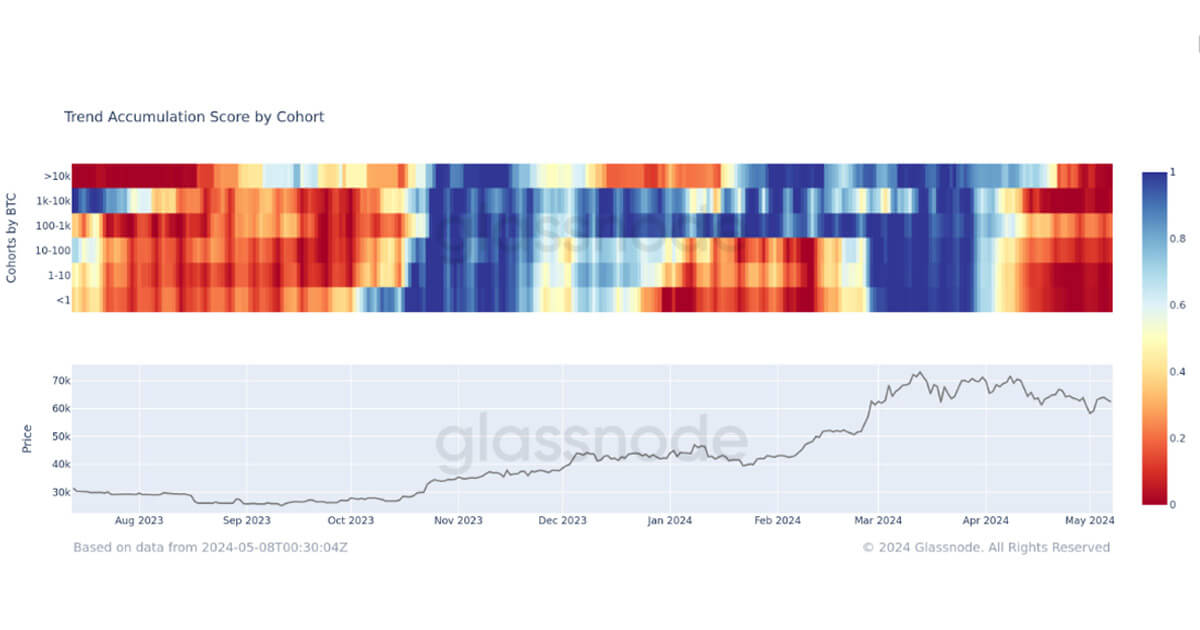
The Bitcoin (BTC) accumulation phase seems to have started as the BTC price wanders below the $60,000 mark for a week. According to data provided by Glassnode, the BTC accumulation trend surged from 0.05 on June 1 to 0.44 as…

Similar to Notcoin - Blum - Airdrops In 2024

origin »

Bitcoin (BTC) на Currencies.ru

$ 64112.17 (-0.25%)
Объем 24H $29.056b
Изменеия 24h: 1.14 %, 7d: 6.27 %
Cегодня L: $64112.17 - H: $64274.11
Капитализация $1266.759b Rank 1
Цена в час новости $ 57050.22 (12.38%)

btc accumulation bitcoin glassnode trend provided according

btc accumulation → Результатов: 126


Фото:

Bitcoin Price Analysis: Slow Upward Drift Tests Market Supply

A slow, grinding upward drift has been the name of the game for bitcoin’s market over the last few weeks. The upward drift is bringing us slowly to a level that was previously rejected violently:Figure 1: BTC-USD, Daily Candles, Upward DriftOur third rejection of the red resistance level shown above brought the market into a test of macro support in the mid-$3,000s.

2019-3-23 01:23


Фото:

New Data Shows Bitcoin Accumulation is in Full Swing

Bullish signs are everywhere for Bitcoin (BTC) March 1st as the largest cryptocurrency continues its record-breaking bear market cycle in 2019. Addresses Amassing Coins At 4K Capping a fifth day of broad stability, the bitcoin price was holding steady at around $3850 Friday, while data from traders suggested February ended the worst six-month performance for bitcoin ever recorded.

2019-3-1 18:00


Фото:

Bitcoin Price Analysis: Strong Move Likely Following Tightly Coiled Market

Days and days of sideways consolidation and tightening volume has been the name of the game for the bitcoin market. A narrow range of $200 has caused a weeks worth of activity to coil and consolidate in preparation for bitcoin’s next move:Figure 1: BTC-USD, Daily Candles, Narrow RangeThe figure above shows just how narrow the range has been over the last week as the market has continued to grind out support and fail to break above overhanging resistance.

2019-1-26 03:13


Ether Price Analysis: Historic Support Tested Amid Signs of Distribution

It’s been weeks since ether has seen a new high or a new low and the market has found itself range-bound. At the moment, we are seeing signs of distribution as large rounds of selling have remained present during key support tests:Figure 1: ETHUSD, 4 Hour Candles, Trading RangeSo far, for the last few weeks, ether has seen a trend of higher lows and low highs (the converging red trendlines).

2018-10-20 01:31