2020-10-12 10:00 |
Ethereum has undergone a strong bounce since the lows seen in September. As of this article’s writing, the coin trades for $372, around 20% above those lows. The cryptocurrency is about the set a weekly close above the $365-370 resistance. Despite this strong bounce in the price of Ethereum, on-chain metrics show that the blockchain is currently weakening. Fortunately, the leading cryptocurrency has positive fundamental and technical trends that may result in growth in the future. Ethereum On-Chain Metrics Are Weakening
Etheruem has undergone an extreme bounce since the lows seen in early September. Despite this, the blockchain’s on-chain trends are weakening.
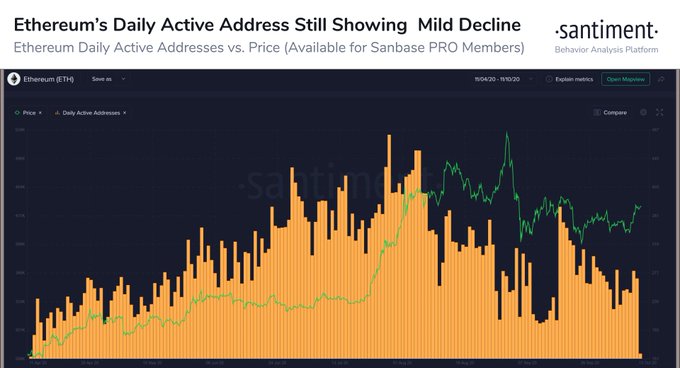
Santiment, a leading blockchain analytics company, reported on October 11th that the number of daily active addresses on Ethereum is still in a “mild decline.” As can be seen, the metric has dropped by around 50% since topping during the rally in late July:
“$ETH’s daily active address metric is still revealing that there is still plenty to be desired since its peak in late July. There has been a decline in unique addresses interacting on the #Ethereum network, particularly since September 17th.”
Chart of ETH's price action over the past few months with an daily active address overlay shared by Santiment, a blockchain analytics company.It seems that this decline comes as many users have lost interest in certain aspects of the decentralized finance space.
Ethereum-based yield farming applications were fuel for an influx of users over the past few months. But with many turning out to be scams, unsustainable, or unprofitable for retail users, they may have stopped using them or are seeking opportunities on other blockchains.
Technical Trends Still StrongEthereum’s technical trends are strong despite the on-chain weakness.
Brave New Coin’s Josh Olszewicz recently noted that the Ichimoku Cloud on the weekly has flipped green, something that hasn’t been seen since late 2018. This suggests that the cryptocurrency is likely to perform “extremely well” throughout Q2 of 2021 and moving on from there:
“1W $ETH. Cloud green for the first time since late 2018 this bodes extremely well for Q2 2021.”
Chart of ETH's price action over the past few years with analysis by crypto trader josh olszewicz (Carpenoctum on Twitter). Chart from TradingView.comOn a shorter-term basis, ETH is breaking above a falling wedge pattern, which is good for the bull case.
Photo by Ryan Clark on Unsplash Price tags: ethusd, ethbtc Charts from TradingView.com Ethereum's On-Chain Metrics Continue to Plunge Despite 20% Bounce origin »Bounce Token (BOT) на Currencies.ru
|
|


