2019-12-18 06:29 |
\n
Since reaching a high on June 26, the Ethereum price has decreased by more than 60 percent. It is currently trading very close to a major support area.
Since the most recent update of the network, Istanbul, many in the Ethereum community had high hopes about Ethereum 2.0 coming soon. However, this enthusiasm was curbed when Ethereum developers stated that the fork will take a long time to be implemented. The official Ethereum blog states that developers are focusing more on upgrading the current Ethereum network, prolonging its life before eventually launching the upgraded network.
This could be read as negative news since the Ethereum price is in dire need of a bounce — since it has been down-trending for 175 days.
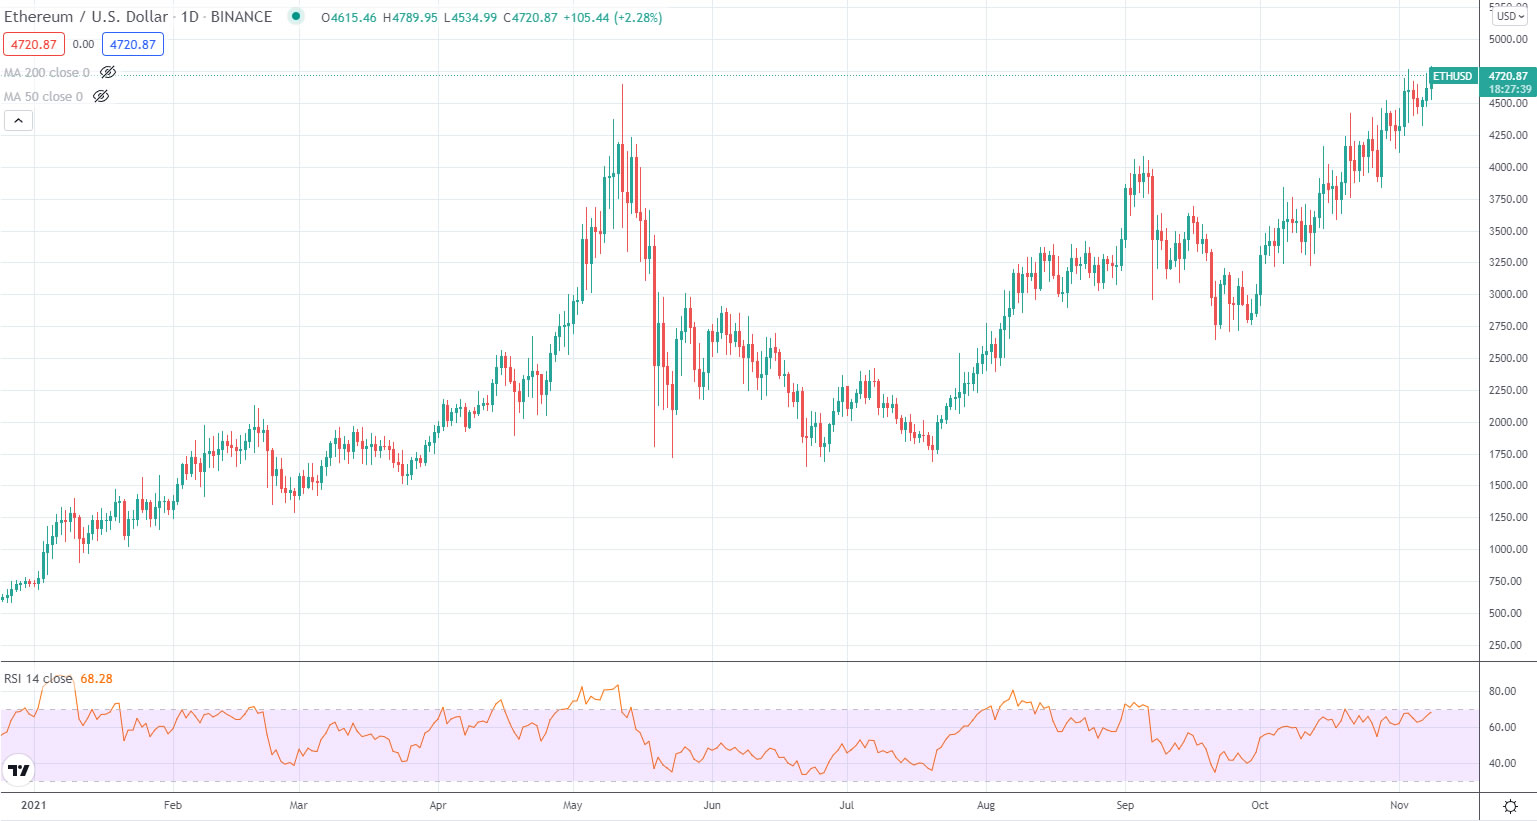
Trader and technical analyst @rektcapital outlined the Ethereum price and the recent validation of the resistance line.
$ETHUSD – $ETH #ethereum
Ethereum flipping the bottom of its Weekly $160-$360 was a major macro event for its price action
ETH has continued its downtrend ever since#Crypto $BTC pic.twitter.com/gzQrghSEhS
— Rekt Capital (@rektcapital) December 17, 2019
He suggested that this was a major event for price action since ETH has been decreasing since validating the resistance area. How long will this decrease continue? Keep reading below if you are interested in finding out.
Ethereum in a Descending ChannelThe Ethereum price has been decreasing since June and trading inside a descending channel since July.
It is currently very close to the support area of $125-$130, while the next one is found at $100.
The most interesting movement comes from the resistance area at $160. The Ethereum price broke down below it and afterward validated it as resistance on November 26. The price has been decreasing since.
This support area seems a very likely place for the initiation of a reversal.
First, projecting the entire height of the previous pattern before the breakdown gives us a target of $125. Second, there is a strong bullish divergence in both the RSI and the MACD. The most common movement from here would be a final drop to validate the support line once more followed by a movement towards resistance. Logarithmic CurveFinally, looking at the entire Ethereum price history in the logarithmic form, we can draw a curved support line to act as the lower limit of price movement.
The line has been validated five times until now and is currently right below the price. If this line is to hold, it would indicate that the Ethereum price will reach a bottom near $125 and will soon begin an upward move. This is in agreement with the daily outlook and readings from technical indicators.
To conclude, the Ethereum price is close to reaching a bottom and has shown strong signs of a reversal. A breakdown below the current descending channel would invalidate this hypothesis and cause the Ethereum price to decrease towards $100.
The post Ethereum’s Downtrend Could Be Coming to an End appeared first on BeInCrypto.
origin »Bitcoin price in Telegram @btc_price_every_hour
Ethereum (ETH) на Currencies.ru
|
|