2024-7-16 16:14 |
Ethereum is starting this week with another 5% gain after closing last week with a huge profit. While testing a minor resistance level, the price looks strong, forming a new bullish pattern on the daily timeframe.
As mentioned in the past weeks, the crucial $2,800 support level has produced a bounce again and as we can see, the market is rising as the bulls continued to show strong commitment by the day.
This surge came after failing to break down to the $2,600 and $2,400 levels in the last correctional phase. Now that the bearish sentiment is fading away, we can expect more bullish actions in the next few days as long as the buying volume level continues to increase.
Currently, it is eyeing the $3,400 level that flipped earlier this month. An increase above this level could bring more recoveries in the market.
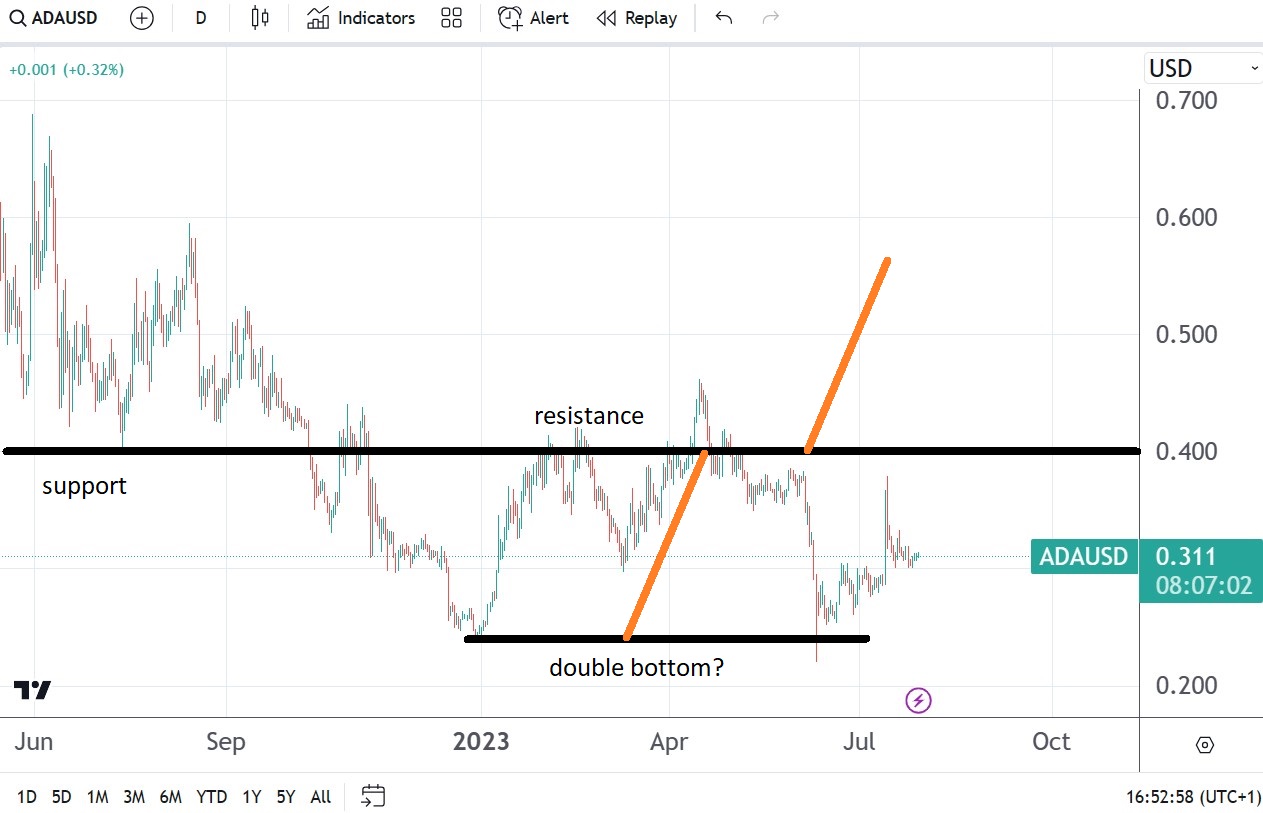
But if we look at the current market structure, Ethereum appeared to form a bullish pattern (double-bottom) on the daily chart. A surge above the $4,000 level will confirm a breakout of structure, setting the price for a massive rally in no time.
The overall market bias remains bullish from a long-term perspective. Right now, the sellers are off the market. If they manage to resume pressure, Ethereum may lose momentum again. With the current market condition, the bulls are more likely to gain more control.
ETH’s Key Level To Watch Source: TradingviewAs the price continues to increase, the immediate resistance for a test is $3,525, followed by the $3,702 level. Above this resistance lies $3,887.
If Ethereum loses momentum, the potential support levels to consider for drops would be $3,222 and $3,059. A drop below the crucial $2,817 support could cause a catastrophic price loss.
Key Resistance Levels: $3,525, $3,702, $3,887
Key Support Levels: $3,222, $3,059, $2,817
Spot Price: $3,364 Trend: Bullish Volatility: HighDisclosure: This is not trading or investment advice. Always do your research before buying any cryptocurrency or investing in any services.
Follow us on Twitter @nulltxnews to stay updated with the latest Crypto, NFT, AI, Cybersecurity, Distributed Computing, and Metaverse news!
Image Source: volody10/123RF // Image Effects by Colorcinch
origin »Ethereum (ETH) на Currencies.ru
|
|
