2019-10-11 22:34 |
ETH is well above its key support of $178Weekly candle looks to be forming a doji, which is preceded with a downtrend so that might signal a long-term trend reversalLower timeframes, like 4H, signal a bullish cross of MA50 and MA200 with price hovering above that intersection.
Ethereum is one of the altcoins that had a positive week – it is 9% up on dollar and 6% on BTC.
It is still sitting as the second largest coin by market cap with $20 billion in market cap and $8.3 billion of trading volume, most done on CoinEgg and Fatbtc exchanges.
Before we dive into the ETH status and chart reading, let’t throw a swift glance on the overall market conditions.
Total market cap analysisLet’s take a look at what the overall market is doing. It is a well known fact that all coin prices are highly correlated with bitcoin’s price action and by extension with the whole market. Every time we see a surge or plunge of the total market cap, it spills over to the individual coins and their prices.
Read our updated guide on best trading bots.
Market has made a solid recovery yesterday, gaining around $7 billion, lead by bitcoin and high cap altcoins. The market managed to break through the sturdy resistance at $214 billion (data by Tradingview, CMC data is off by approx +$8 billions). It hit the EMA20 which acted as a resistance and the market bounced off of it. We are right now at $222 billion and should the total cap break through the above mentioned EMA resistance zone, we could see a swift move up to the $240 billion zone, area from which we saw this horrific drop in the last week of September.
ETHUSDAs mentioned above, ETH looks good against USD. The price is hitting the Fib50 of the Sept 26th low and August 6th high.
There are no major resistances for ETH above this line all the way up to $221 zone where it got rejected couple of times back in September.
Upside potential from here is for ETH to break the $200 and meet its MA200 at around $210 which could prove to be a tougher resistance.
Downside scenario: support is right now provided by the EMA20 and MA50 right below the current price action at around $190. Below that, there are two more notable support zones at $178 and $173.
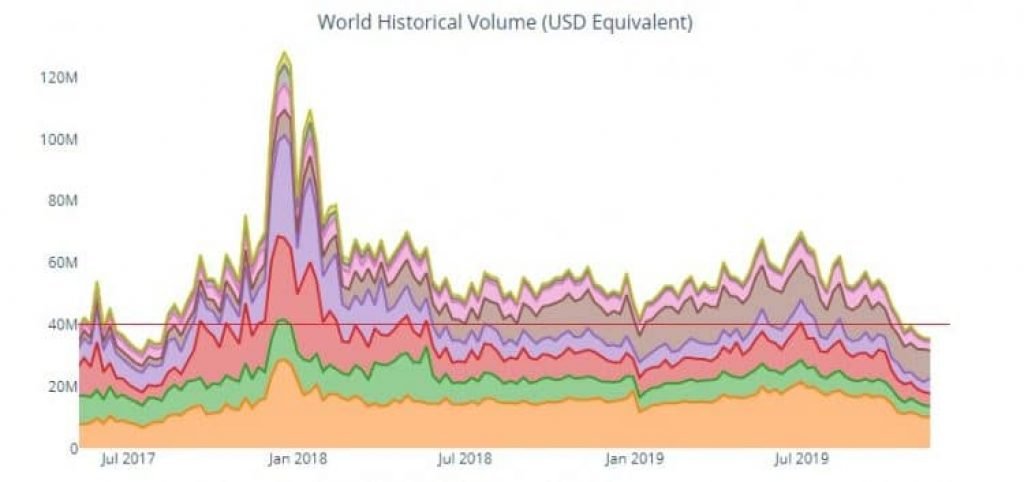
Trading volume and buy supportTrading volumes are looking weak, according to Messari (data is different to CMC data): reported volume in the last 24 hours was $2 billion and “Real 10” volume was $100m.
So, the reported volume is almost 20x larger than the “Real 10” volume (trading volume on the exchanges that prevent wash trading). This means that ETH liquidity is seriously inflated which is pretty common among the top coins that have their metrics inflated by huge figures (20x discrepancy is not uncommon).
Read our updated guide on best ETH wallets.
Additionally, ETH comparatively has a decent buy support, according to coinmarketbook.cc. Buy support is measuring sum of buy orders at 10% distance from the highest bid price.
This way we can eliminate fake buy walls and whale manipulation and see the real interest of the market in a certain coin. ETH currently has $53 million of buy orders measured with this method, which sets ETH buy support/market cap ratio at 0.26% which is a similar ratio to bitcoin and bitcoin cash. This novel metric indicates there are a lot of manipulations, inflated liquidity and fake orders on ETH trading pairs.
The post Ethereum (ETH) Price Analysis – $200 About To Get Conquered appeared first on CaptainAltcoin.
origin »Ethereum (ETH) на Currencies.ru
|
|


