2022-8-5 15:00 |
Enjin Coin (ENJ) has been moving upwards since June 18 and is currently attempting to break out from a short-term horizontal resistance area.
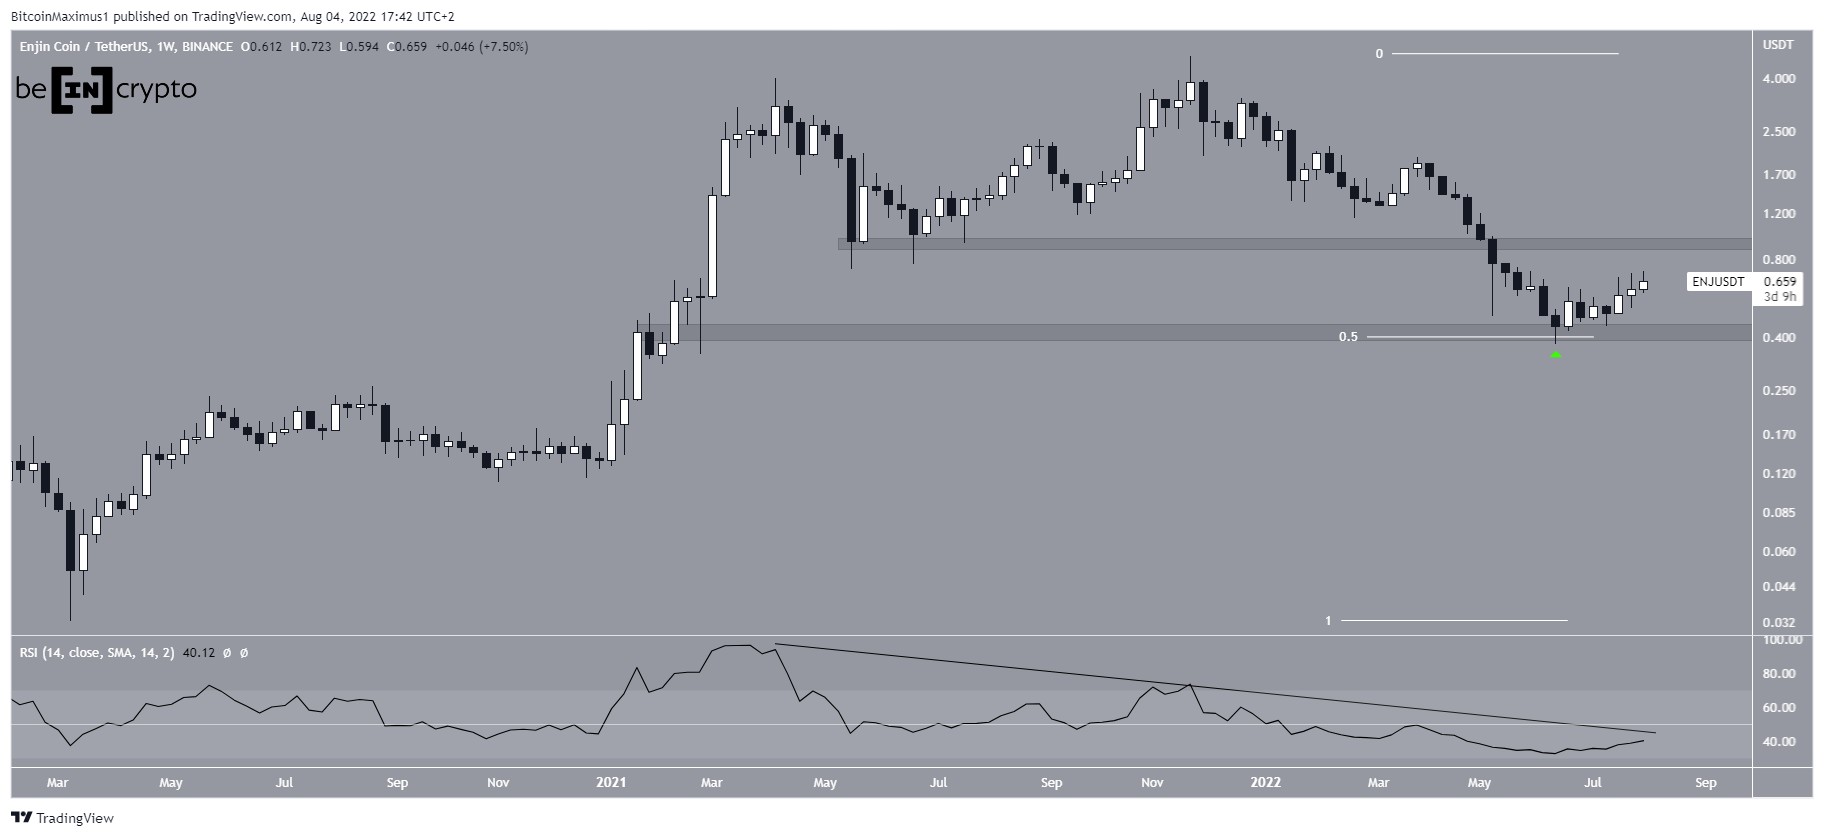
ENJ has been falling since reaching an all-time high price of $4.85 in Nov. The downward movement so far led to a low of $0.378 in June.
The price bounced afterwards (green icon) and validated the 0.42 horizontal area as support. This is a crucial area since it provided strong support in March 2021 and is also the 0.5 Fib retracement support level when measuring the entire upward movement since March 2020.
Even though ENJ has bounced, technical indicator do not yet confirm the bullish reversal, since the weekly RSI is still below 50 and has not yet broken out from its bearish divergence trend line (black).
If the upward movement continues, the closest resistance area would be at $0.93.
ENJ/USDT Chart By TradingView ENJ breaks outThe daily chart provides a bullish outlook. On June 6, ENJ broke out from a descending resistance line that had been in place since the all-time high price.
At the time of the breakout, the line had been in place for 193 days. Breakouts from such long-term structures usually lead to significant upward movements.
Furthermore, the daily RSI has generated bullish divergence and has now moved above 50. Both of these are considered signs of a bullish trend.
In this time frame, the closest resistance area would be at $1.33.
ENJ/USDT Chart By TradingViewFinally, the six-hour chart shows that ENJ has been following an ascending support line since June 20, and broke out from a short-term descending resistance line (dashed).
Over the past week, it has made several breakout attempts (red icons) above the $0.675 horizontal resistance area. However, they have all been unsuccessful, leading to the creation of long upper wicks (red icons).
Nevertheless, resistances get weaker each time they are touched, suggesting that an eventual breakout is expected. So, a breakout from the $0.675 minor resistance area would likely accelerate the rate of increase.
ENJ/USDT Chart By TradingView Wave count analysisCryptocurrency trader @cvotrades tweeted a chart of ENJ, stating that the price could rapidly increase towards $1.
Source: TwitterAs for the short-term count it is possible that ENJ began a new five-wave upward movement (white) on June 18. If correct, it is mired in a 1-2/1-2 wave formation, meaning that it will soon accelerate its rate of increase inside wave three.
The sub-wave count is given in yellow. A decrease below the sub-wave two low (red line) at $0.514 would invalidate this particular wave count and indicate that the trend is bearish instead.
ENJ/USDT Chart By TradingViewFor Be[in]Crypto’s latest Bitcoin (BTC) analysis, click here
The post Enjin Coin (ENJ) Breaks out From Long-Term Descending Resistance Line appeared first on BeInCrypto.
origin »Bitcoin price in Telegram @btc_price_every_hour
Coin(O) (CNO) на Currencies.ru
|
|


