2021-5-13 23:14 |
Bitcoin, Ethereum, and just about every other asset on the planet trades against the dollar on its most liquid trading pair, and the greenback is the base currency that all exchanges rates are based on. The power and influence of the almighty dollar cannot be understated, and the crypto market could soon feel the surprising sting of the global reserve currency.
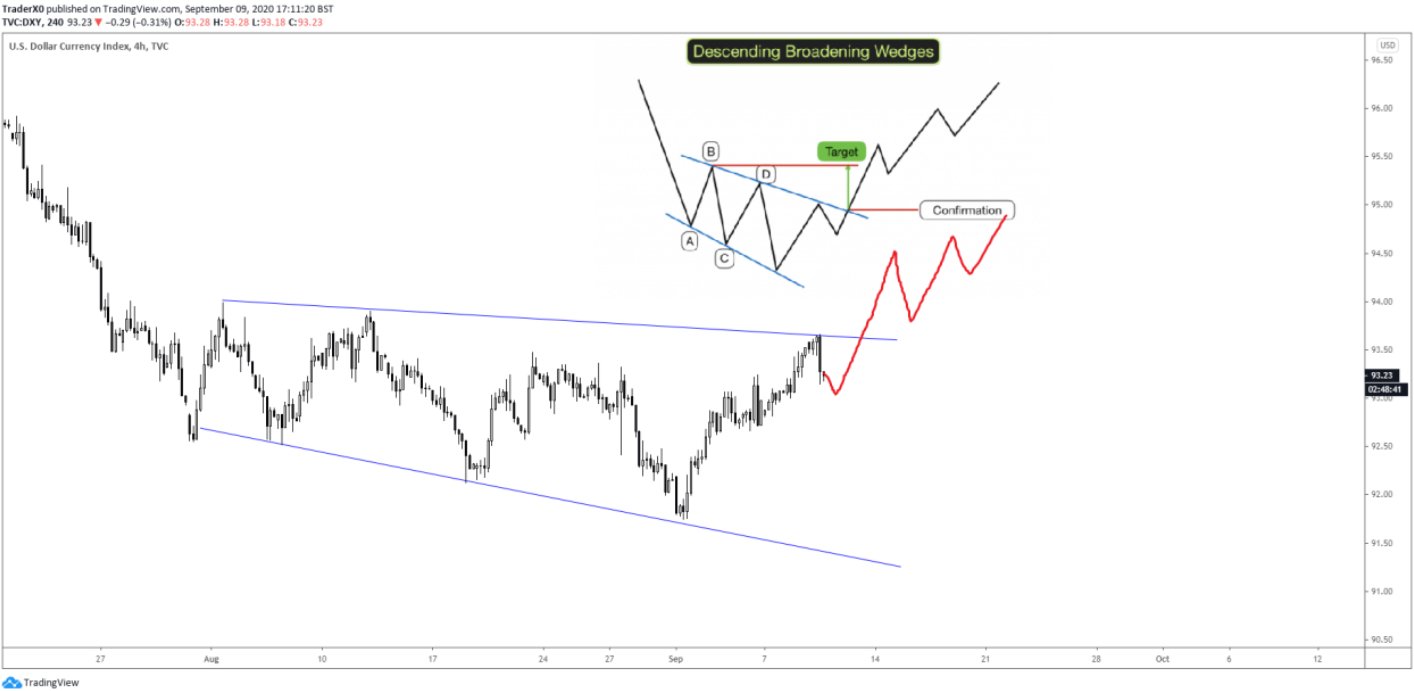
A double bottom could be forming on the dollar, with a hidden bullish signal that could bring a hurting to the currently overheated stock and crypto market. Here’s a closer at the double bottom formation that could put a stop to Bitcoin’s bull market.
Double-Bottom Forms On The Dollar Currency IndexThe slow death of the dollar has let equities and crypto assets like Bitcoin fly like never before, during a time when the economy was on pause and unemployment was climbing. Stimulus money kept things afloat, while those who didn’t need the money for essentials bought shares of GameSpot and hundreds of thousands of DOGE.
Related Reading | Broken Parabola: Mapping Out The Bitcoin Bull Market And More
The soaring market caps of assets everywhere was a glaring sign that inflation was getting out of hand, and the US government has been taking steps to reel things in. And it has already taken a toll on Bitcoin, resulting in the top cryptocurrency returning to below $55,000.
Recent comments about stock market “froth,” “risk appetite,” and a random warning today from the SEC that Bitcoin is a “highly speculative” asset are suspect in terms of timing.
At the same time, an Adam and Eve double bottom could be forming on the DXY Dollar Currency Index, and it is ready to take a dent out of crypto gains.
Is an Adam and Eve bottom forming on the dollar? | Source: DXY on TradingView.com Why Bitcoin Could Be In Trouble If The Greenback BouncesAn Adam and Eve double bottom is a rare structure that results in new highs. Failure, sends the asset tumbling even lower than the support level that greenback bulls are attempting to confirm as ironclad.
This type of double bottom structure is also found on the likes of Litecoin and other cryptocurrency price charts.
Superimposing the Bitcoin price chart specifically over the same DXY price chart, with the logarithmic MACD activated, things become more clear regarding the bearish change in trend that could be taking place.
Bitcoin could be due for a reversal if the DXY rips higher | Source: DXY on TradingView.comThe last major rebound and bullish crossover in the DXY also was the peak of the 2017 bull market. The dollar bounced sharply, while the first ever cryptocurrency started a bear market.
Related Reading | Creator Of Flawless Top Indicator Says Bitcoin Isn’t Done, Despite Signal
This time around, the dollar is taking its sweet time in turning around, forming a short-term double-bottom in addition to the longer-term one dating back to the last cycle top.
There’s also a hidden bullish divergence forming on the LMACD, all while Bitcoin grinds at resistance, struggles with $60,000, and rare top signals have appeared. Is this the end of the Bitcoin bull run already, or will the dollar’s attempt to get back on its feet fall flat on its green back?
Featured image from iStockPhoto, Charts from TradingView.com origin »Bitcoin price in Telegram @btc_price_every_hour
Dollar Online (DOLLAR) на Currencies.ru
|
|


