2021-10-18 20:00 |
After decreasing for more than two months, Dogecoin (DOGE) is finally showing signs of a potential bullish reversal.
While not yet confirmed, it is possible that this is the beginning of a long-term upward movement for DOGE.
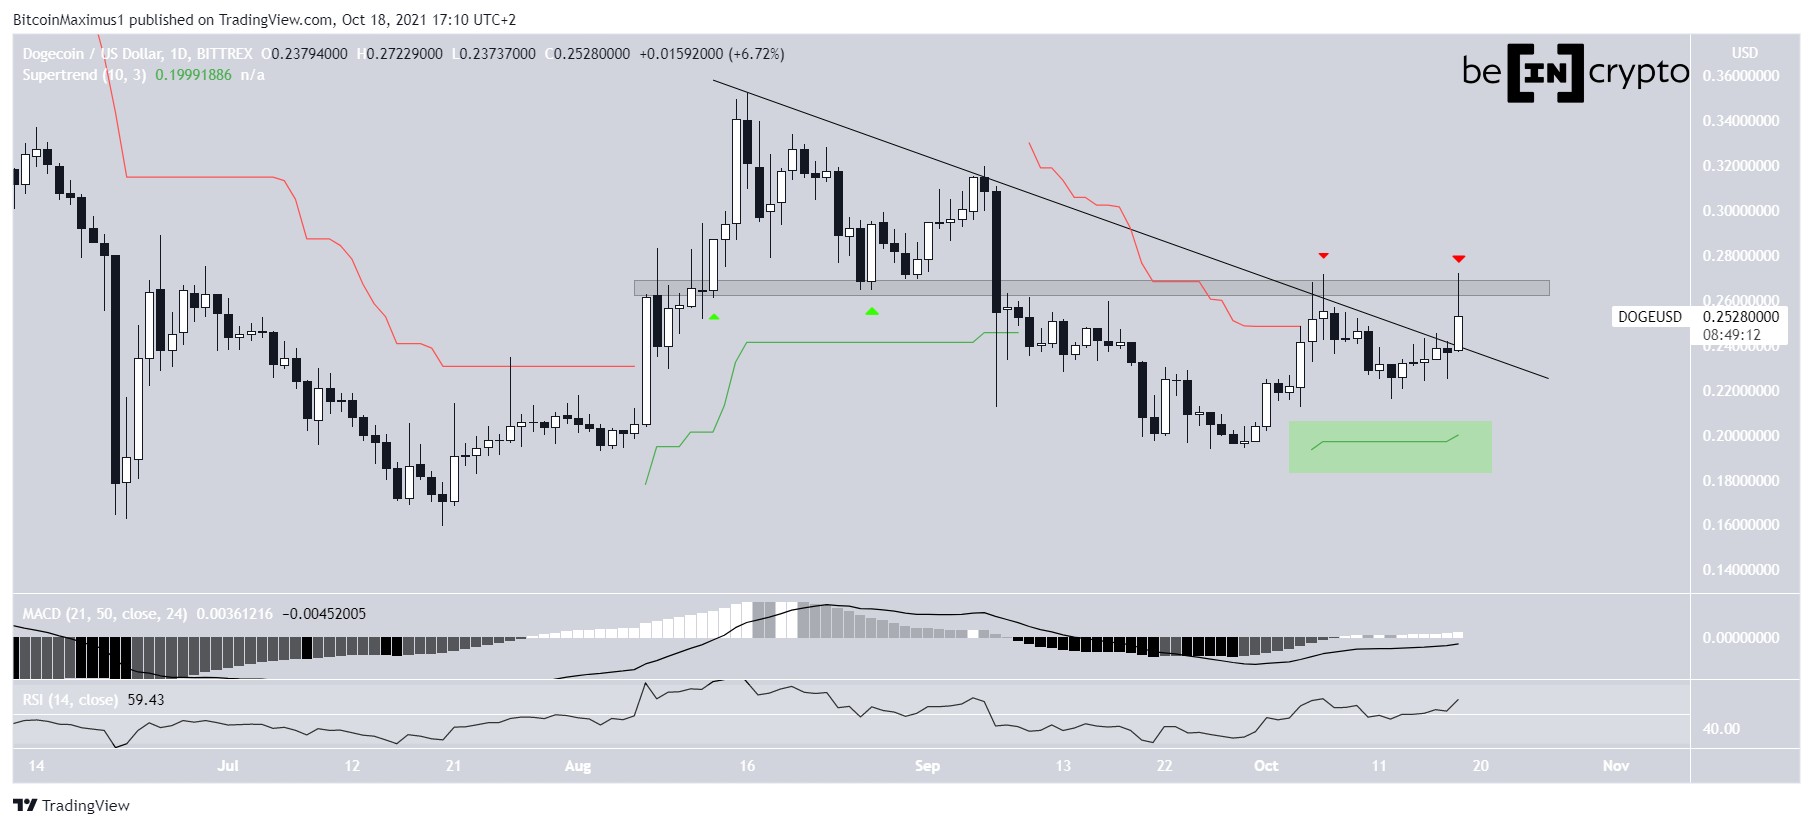
DOGE breaks outBeginning on Aug 16, DOGE had been decreasing alongside a descending resistance line. This was a sign that DOGE was correcting after the preceding upward movement.
The token reversed trend on Sept 26 and has been moving upwards since.
Initially, it was rejected by both the resistance line and the $0.266 resistance area on Oct 6 (red icon). Afterwards, it managed to break out above the descending resistance line on Oct 18. However, it has failed to reclaim the $0.266 resistance area.
Despite the failure to do so, technical indicators for DOGE in the daily time-frame are bullish.
Firstly, the Supertrend is bullish (green icon). The Supertrend is an indicator that uses absolute high and low prices in order to determine the trend. Since the price is above the line, the reading is considered bullish.
Secondly, the MACD is positive and increasing. The MACD is created by a short- and long-term moving average (MA), and this measn that the short-term trend is faster than the long-term one.
Finally, the RSI has moved above 50 and is increasing. The RSI is a momentum indicator, and the cross above 50 is a sign of bullish momentum.
Therefore, the daily time-frame indicators are in agreement and suggests that DOGE is mired in a bullish trend. A reclaim of the $0.266 resistance area would further confirm this.
Chart By TradingView Wave countCryptocurrency trader @Altstreetbet outlined a DOGE chart, stating that the token is in wave three of a bullish impulse. This is usually the sharpest, meaning the rate of increase could greatly accelerate in the near future.
Source: TwitterThe most likely does does indeed suggest that DOGE is in wave three (orange) of a five wave bullish structure. Besides being the sharpest one, wave three is the most likely wave to extend. Therefore, the sub-wave count which would complete an extended wave three is given in black.
The most likely target area for the top of this wave is between $0.50 and $0.515. The target is created by the 1.61 length of wave one (orange) and 0.618 Fib retracement resistance level (black).
Afterwards, the entire formation containing waves four and five would likely end with a new all-time high.
The scenario remains valid as long as the sub-wave two low of $0.216 (red line) is not broken.
Chart By TradingViewFor BeInCrypto’s latest Bitcoin (BTC) analysis, click here.
What do you think about this subject? Write to us and tell us!
The post Dogecoin (DOGE) Correction Looks Complete, Shows Signs of Long-Term Upward Movement appeared first on BeInCrypto.
origin »Bitcoin price in Telegram @btc_price_every_hour
Dogecoin (DOGE) на Currencies.ru
|
|


