2021-10-13 21:54 |
In order to put an end to the descent that has been ongoing since Aug 16, Dogecoin (DOGE) has to break out from the current pattern.
Technical indicators do not confirm the possibility of a reversal. However, the price action suggests that a breakout is the most likely scenario
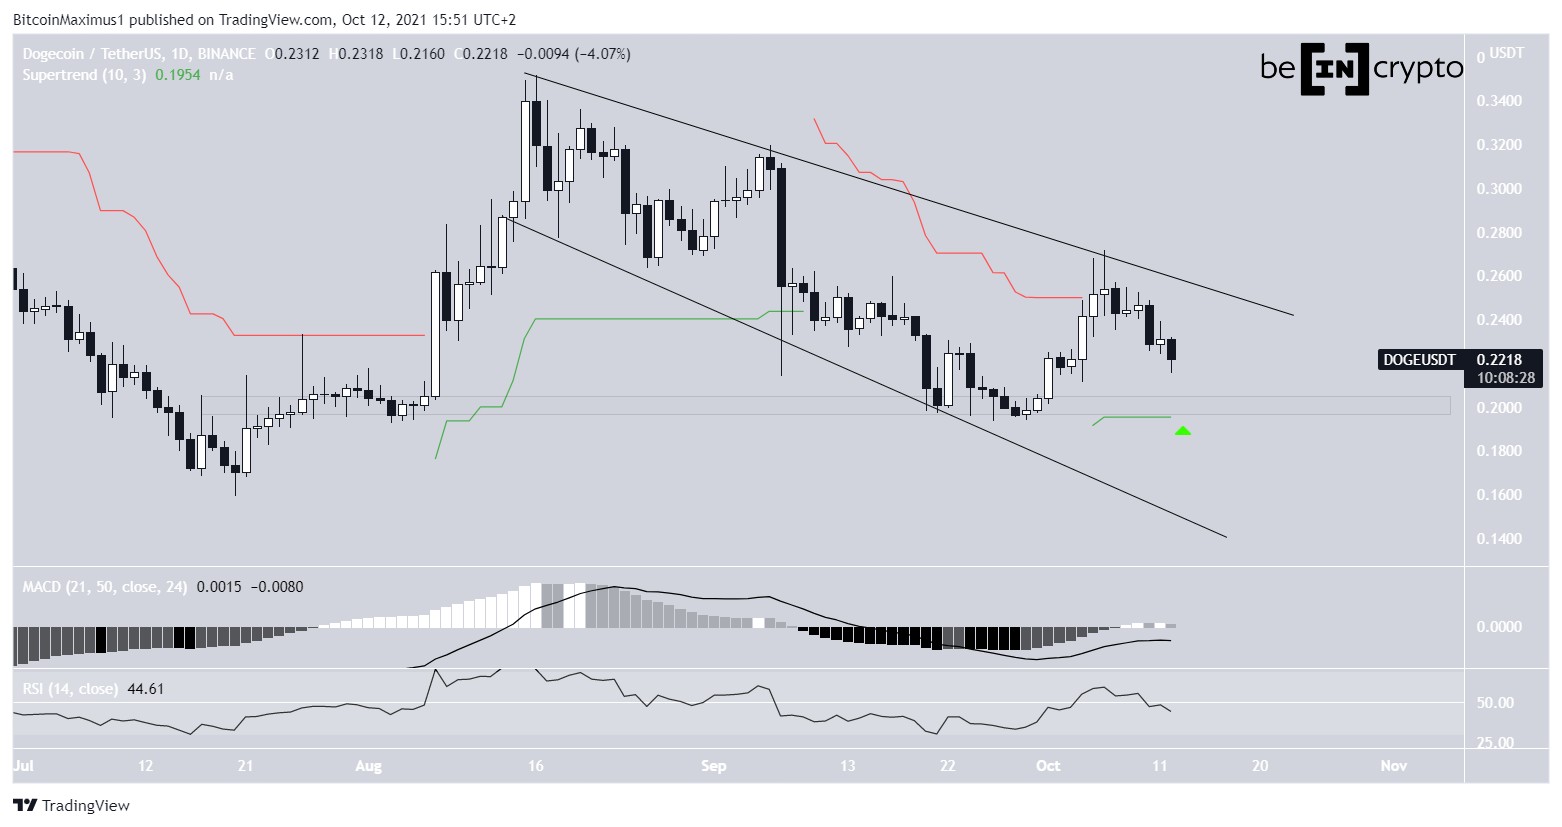
Ongoing descentDOGE has been moving downwards since Aug 16, when it reached a high of $0.35. The decrease has taken the shape of a descending broadening wedge. This is considered a bullish pattern, meaning that the majority of times the price is expected to break out from it.
However, technical indicators fail to confirm the possibility of a breakout.
The MACD is below the 0 line and has begun to decrease. The MACD is created by a short- and a long-term moving average (MA). The fact that it is below the 0 line indicates that the short-term trend is slower than the long-term one.
Furthermore, the RSI is right at the 50 line. The RSI is a momentum indicator, and a reading of 50 is a sign of a neutral trend.
Therefore, the daily time-frame readings are not sufficient in determining the direction of the trend.
However, there is strong support for DOGE at $0.20. This is created by both a horizontal support area and the Supertrend line (green icon). The Supertrend is an indicator that uses absolute high and low prices in order to determine whether the trend is bullish or bearish. Since the price is above the Supertrend line, the trend is considered bullish. Also, the line is likely to act as support.
As a result, some type of bounce is expected once DOGE gets there.
Chart By TradingView DOGE Wave countCryptocurrency trader @Thetradinghubb outlined a DOGE chart, in which the token will increase towards at least $0.44 and potentially to a new all-time high.
Source: TwitterThe first possibility suggests that the upward movement is an A-B-C corrective structure. This means that the entire increase is corrective. Therefore, once it is complete, DOGE will decrease towards new lows.
However, there is still an upward movement left prior to the potential drop.
The most likely levels for the top of the upward movement, which is this case would be the C wave are at $0.44 and between $0.50-$0.515.
The first level would give waves A:C a 1:1.27 ratio (orange) and would coincide with the 0.5 Fib retracement resistance level (black).
The second one would give waves A:C a 1:1.61 ratio and would coincide with the 0.618 Fib retracement resistance level.
Chart By TradingView Alternate scenarioThe short-term movement in the alternate scenario is the same, however the long-term one differs.
The difference is that instead of being a C wave, the ongoing increase is part of wave three of a bullish impulse. The sub-wave count is given in black.
This means that instead of reversing once the upward movement is complete, DOGE will correct for a short period of time before continuing its ascent.
The shape of the ongoing increase will determine which is the correct movement. The closer DOGE gets to the $0.50 level, the higher the chances that this is the correct count.
Furthermore, if the token does not break the $0.35 high (red line), it would confirm that this indeed is the correct count.
Chart By TradingViewFor BeInCrypto’s latest Bitcoin (BTC) analysis, click here.
What do you think about this subject? Write to us and tell us!
The post Dogecoin (DOGE) Approaches Long-Term Support – Will It Bounce? appeared first on BeInCrypto.
origin »Bitcoin price in Telegram @btc_price_every_hour
Dogecoin (DOGE) на Currencies.ru
|
|


