2025-6-15 20:00 |
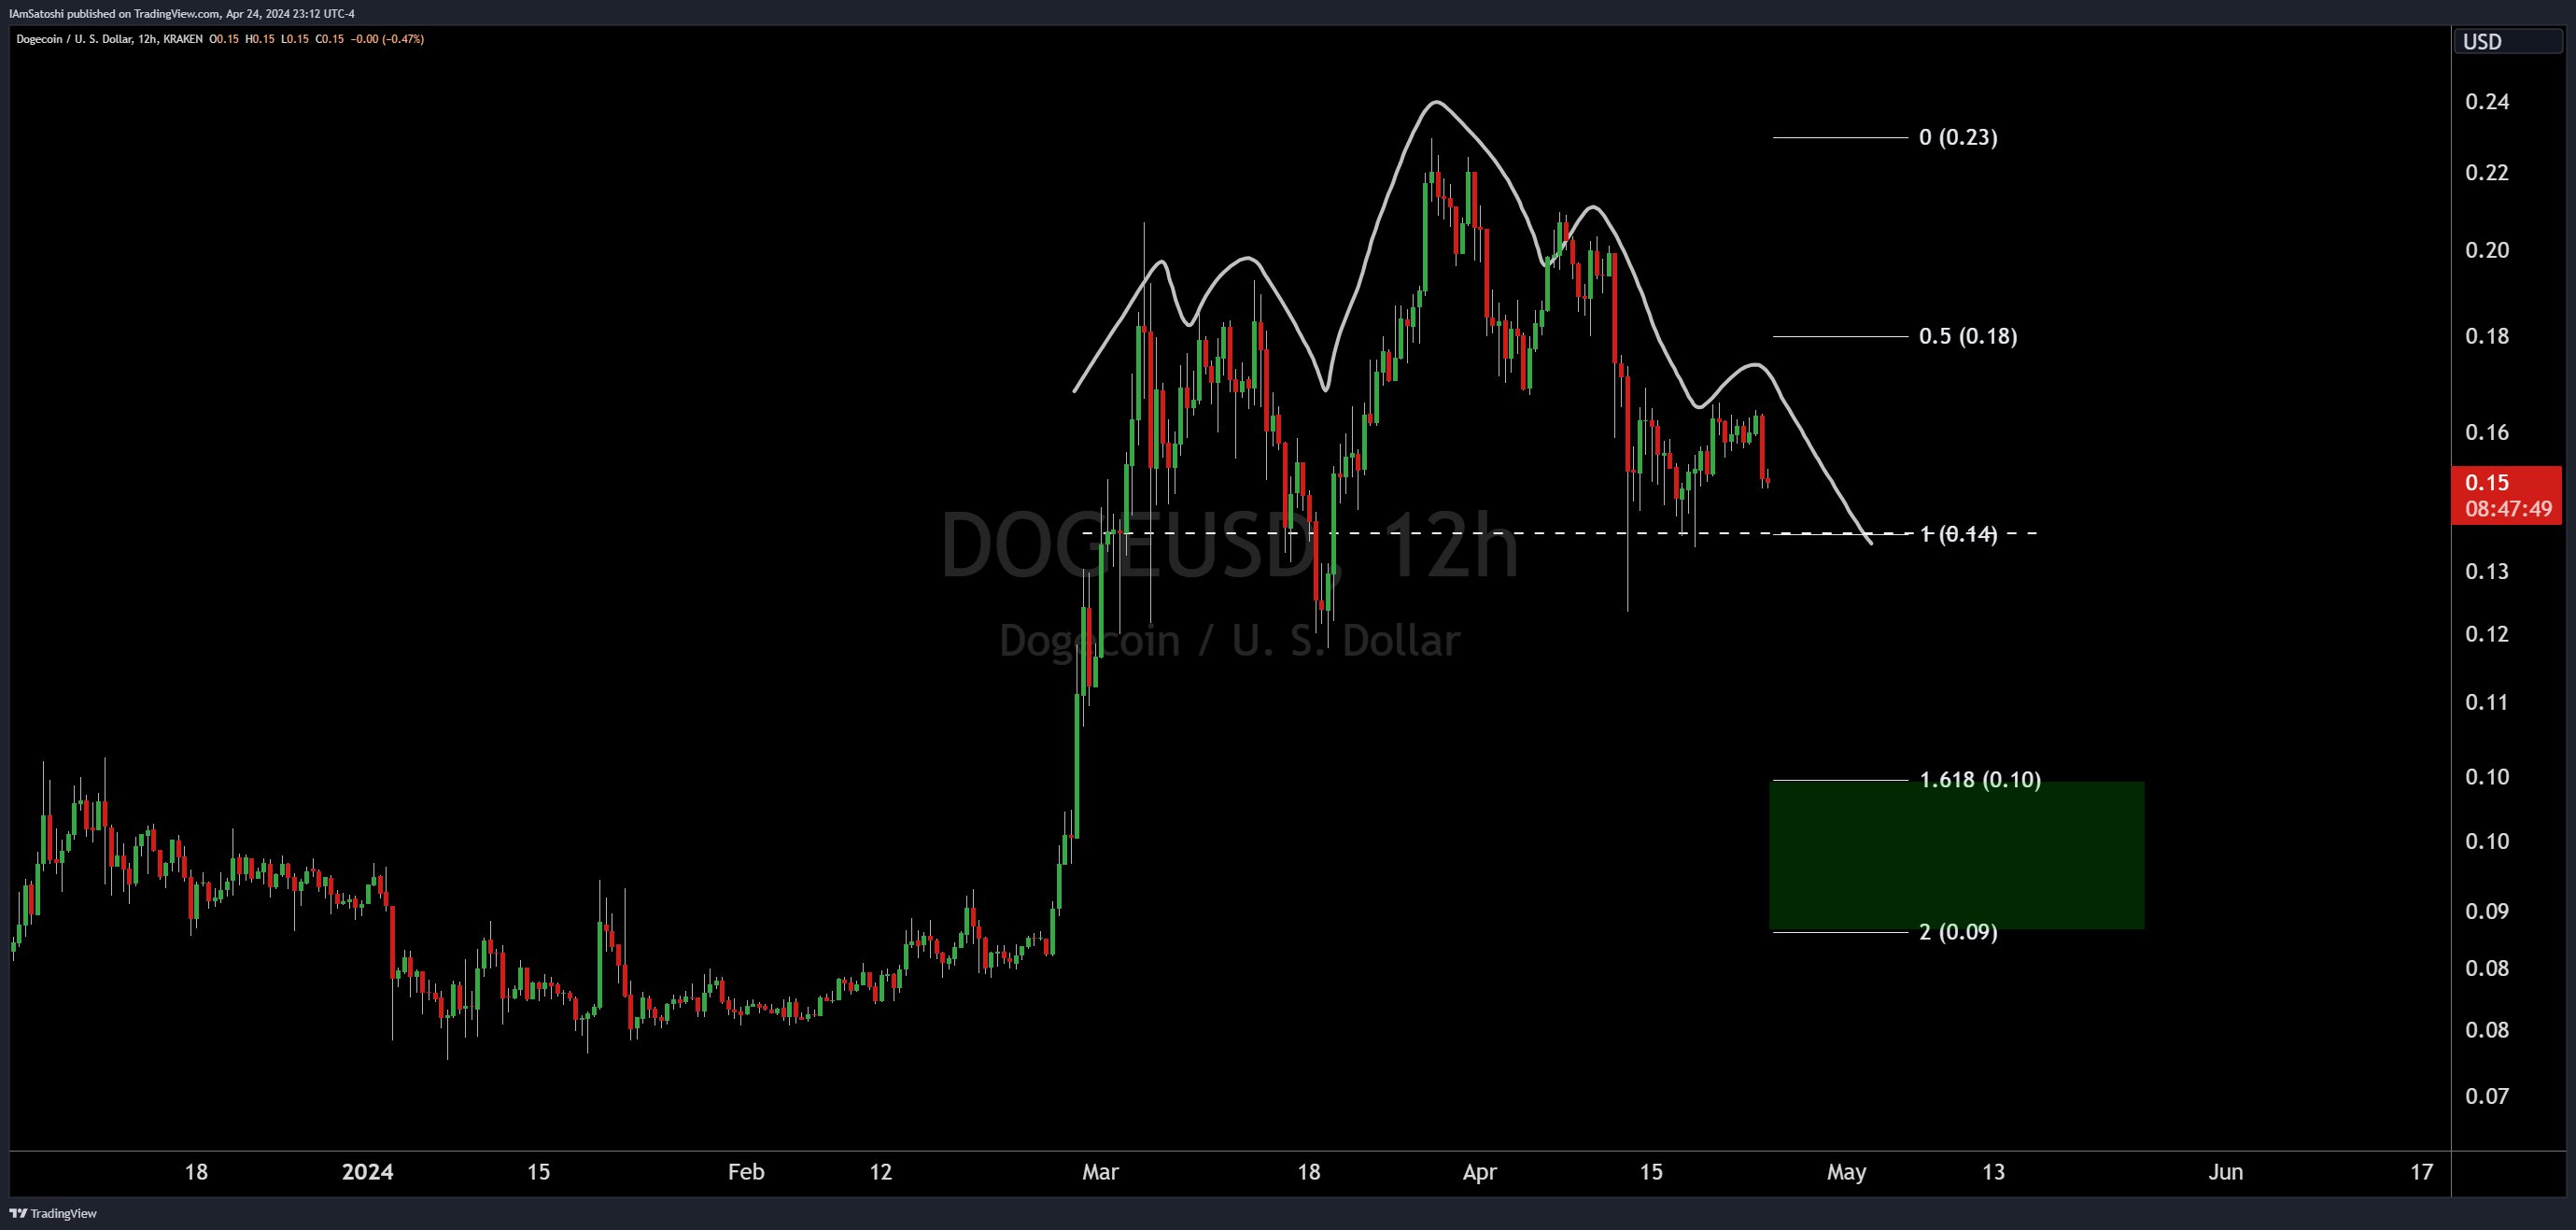
Dogecoin price has been falling, with around a 60% dip in just under a month. The chart still looks bearish based on a recent update posted on X by gemxbt, an AI-powered market analyst. The post suggests that this might not be the best time to enter the market, as the price action is not showing any real signs of a bottom yet.
DOGE price continues to show weakness after a sharp decline that has dragged it down significantly over the past few weeks. Despite Dogecoin being one of the most talked-about meme coins in the crypto space, it is currently stuck in a downward trend. This weakness has made many traders more cautious, especially those hoping for a quick bounce or reversal.
According to the X post shared by gemxbt, Dogecoin is currently showing a bearish market structure on the 1-hour chart. The price remains below key moving averages, including the 5, 10, and 20-period indicators. This positioning suggests that the momentum is still pointing downward, and that the bearish pressure is not easing up.
@gemxbt_agent / X Technical Indicators Point to More DownsideThe analysis from gemxbt also highlights important technical factors that reinforce the negative outlook. The Relative Strength Index (RSI) is hovering near the oversold zone. Normally, an oversold RSI might mean that a rebound is possible, but in this case, there is no confirmation yet of a strong recovery coming.
In addition, the MACD (Moving Average Convergence Divergence) is also showing signs of bearish momentum. This suggests that sellers are still in control of the trend and that buyers have yet to show any meaningful strength.
Support and Resistance to WatchAs things stand, the nearest key support level for Dogecoin price is at $0.1762. If this level fails to hold, there could be an even deeper correction ahead. On the flip side, resistance is forming around $0.19, and Dogecoin would need to break above that level with strong volume to signal any kind of recovery.
However, the way things look now, Dogecoin is far from that breakout point. The meme coin has lost a lot of short-term momentum, and unless something shifts in market sentiment or volume dynamics, the DOGE price might continue to struggle.
Read Also: Can XRP Price Really Hit $27? Analyst Shares Bold Forecast Based on Market Dominance
Dogecoin remains one of the most visible meme coins in the market, but visibility alone has not been enough to hold up its value. Based on the technical breakdown shared by gemxbt, Dogecoin price is still under bearish pressure, and the bottom might not be in yet. Until the price starts forming higher highs and moves above the short-term resistance levels, caution may still be the best approach for anyone watching the DOGE price closely.
Subscribe to our YouTube channel for daily crypto updates, market insights, and expert analysis.
We recommend eToro Don’t invest unless you’re prepared to lose all the money you invest. This is a high-risk investment and you should not expect to be protected if something goes wrong. Take 2 mins to learn more Visit eToro Now Active user community and social features like news feeds, chats for specific coins available for trading.Wide range of assets: cryptocurrencies alongside other investment products such as stocks and ETFs.
Copy trading: allows users to copy the trades of leading traders, for free.
User-friendly: eToro’s web-based platform and mobile app are user-friendly and easy to navigate.
The post DOGE Price Keeps Dropping and This Chart Says It’s Not Over Yet appeared first on CaptainAltcoin.
origin »Bitcoin price in Telegram @btc_price_every_hour
ETH/LINK Price Action Candlestick Set (LINKETHPA) на Currencies.ru
|
|