2021-6-9 21:05 |
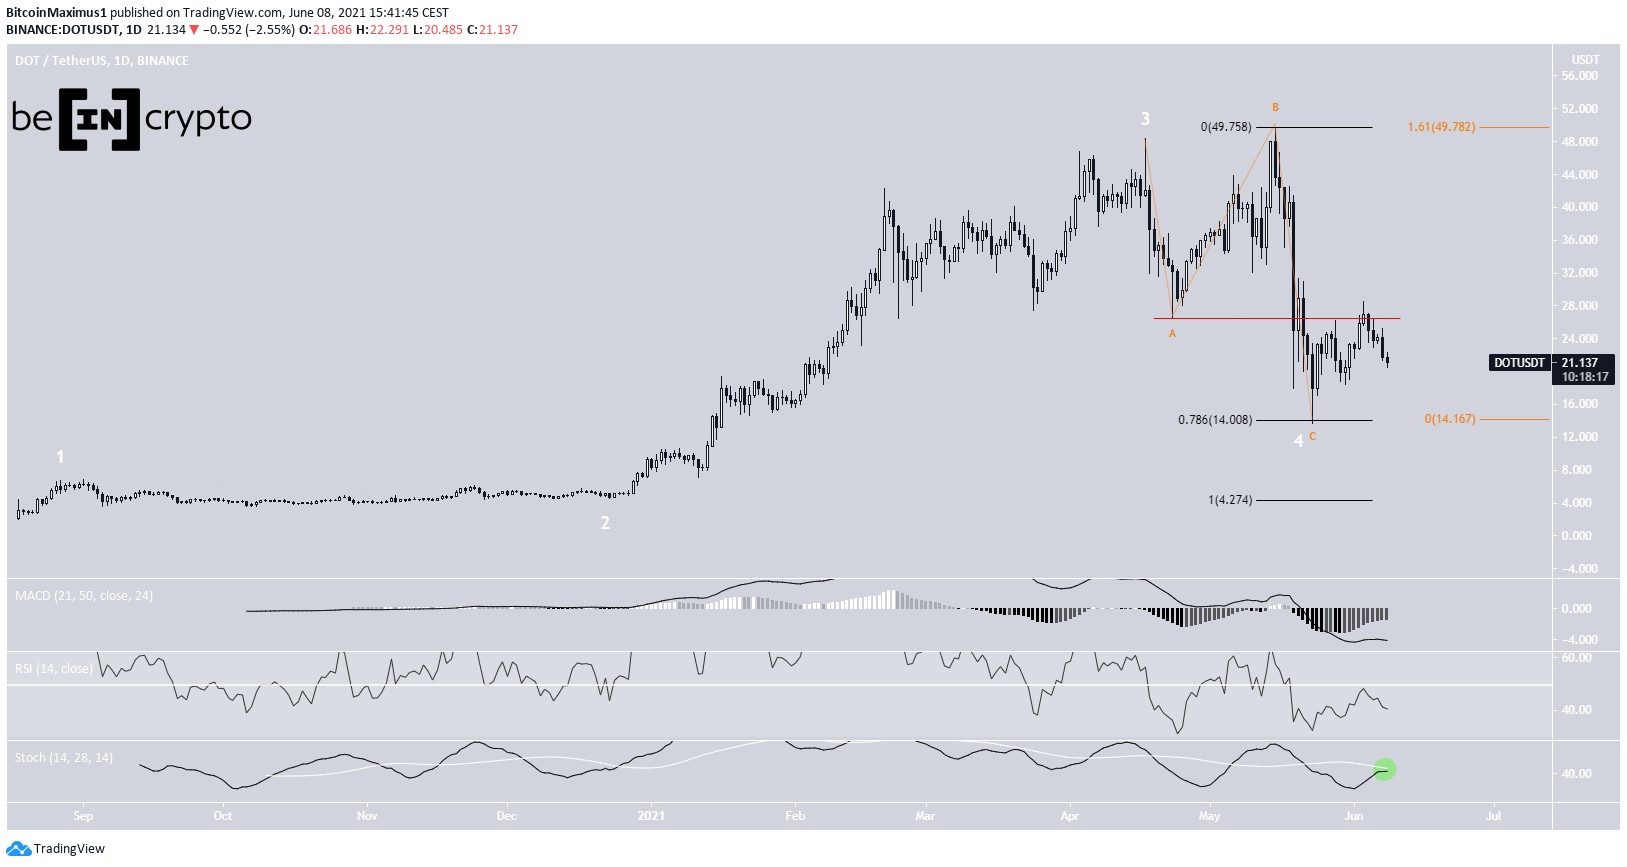
PolkaDot (DOT) has been moving upwards since bouncing at the $14 support area on May 23.
Cream Finance (CREAM) is trading inside a range between $100 and $180.
Kava.io (KAVA) is trading inside a long-term descending parallel channel and following a short-term ascending support line.
DOTOn May 23, DOT reached a low of $13.63 and bounced. The ensuing upward movement took it to a high of $28.60 on June 3. The token has been moving downwards since.
The overlap (red line) with the previous low of $26.63 indicates that the ongoing decrease is an A-B-C corrective structure instead of being a bearish impulse. Furthermore, waves A:C (orange) had a 1:1.61 ratio, common in such structures.
Technical indicators do not provide clear signs of a reversal. The MACD has given a bullish reversal signal but is below zero. Similarly, the RSI is increasing but is below 50. Finally, the Stochastic oscillator has yet to make a bullish cross (green circle).
Therefore, it is not yet certain if DOT will make another low or create a higher low instead.
Chart By TradingViewThe DOT/BTC pair does look more bullish than its USD counterpart. This is mostly due to the reclaim of the 56,000 satoshi support area, which previously acted as resistance in 2020.
After breaking out, DOT has validated it as support numerous times, most recently on May 23.
However, similarly to the DOT/USD pair, technical indicators have yet to confirm the bullish reversal, providing the exact same readings.
Chart By TradingView CREAMSince Feb. 23, CREAM has been trading inside a range between $100 and $180. Both the support and resistance areas have been validated thrice.
CREAM initiated an upward movement on May 23, taking it all the way to the $180 resistance area. However, it was rejected on June 5 and has been moving downwards since.
Despite the decrease, technical indicators are still bullish. The MACD is positive, the RSI is above 50 and the Stochastic oscillator has just made a bullish cross.
Chart By TradingViewThe shorter-term four-hour chart shows that on May 31, CREAM broke out from a descending resistance lien that had been in place since the beginning of the month.
It proceeded to reach a high of $175.14 before decreasing.
There is strong support between $120-$131, created by both Fib and horizontal levels.
Therefore, it is possible that the token creates a higher low near this area before moving upwards once more.
Chart By TradingView Highlights CREAM is trading inside a range between $100 and $180. It has broken out from a short-term descending resistance line. KAVAKAVA has been trading inside a descending parallel channel since April 6. So far, it has been rejected thrice by its resistance line, most recently on June 2. Currently, it is attempting to find support at the middle of the channel.
Technical indicators are relatively bullish. The Stochastic oscillator has made a bullish cross and the MACD histogram has turned positive (green icons). However, the RSI has fallen below 50.
Nevertheless, parallel channels usually contain corrective movements. Therefore, as long as the token is trading above the middle of the channel, an eventual breakout from it would be likely.
It is possible that this is the beginning of a longer-term fifth wave.
Chart By TradingViewThe BTC pair looks decisively bullish, more so than its USD counterpart. KAVA has already broken out from a descending resistance line. Currently, it is in the process of validating the line and the 11,600 satoshi area as support.
Successfully doing so would be a major bullish development.
In addition, technical indicators are bullish. The MACD is positive and the RSI is above 50. Furthermore, the Stochastic oscillator has made a bullish cross (green).
The next resistance area is at 20,130 satoshis, created by the 0.382 Fib retracement resistance level.
Chart By TradingView Highlights KAVA is trading inside a long-term descending parallel channel. KAVA/BTC has broken out from a descending resistance line.For BeInCrypto’s latest bitcoin (BTC) analysis, click here.
The post DeFi Tokens Create Higher Lows After Reversal appeared first on BeInCrypto.
origin »Defi (DEFI) на Currencies.ru
|
|


