2020-9-9 18:42 |
Coinspeaker
Crypto Price Analysis September 9: BTC, ETH, LTC, BCH, EOS
Dmitriy Gurkovskiy, a senior analyst at foreign exchange broker RoboForex, provides his vision of the possible tendencies in price changes for Bitcoin as well as for other major cryptos.
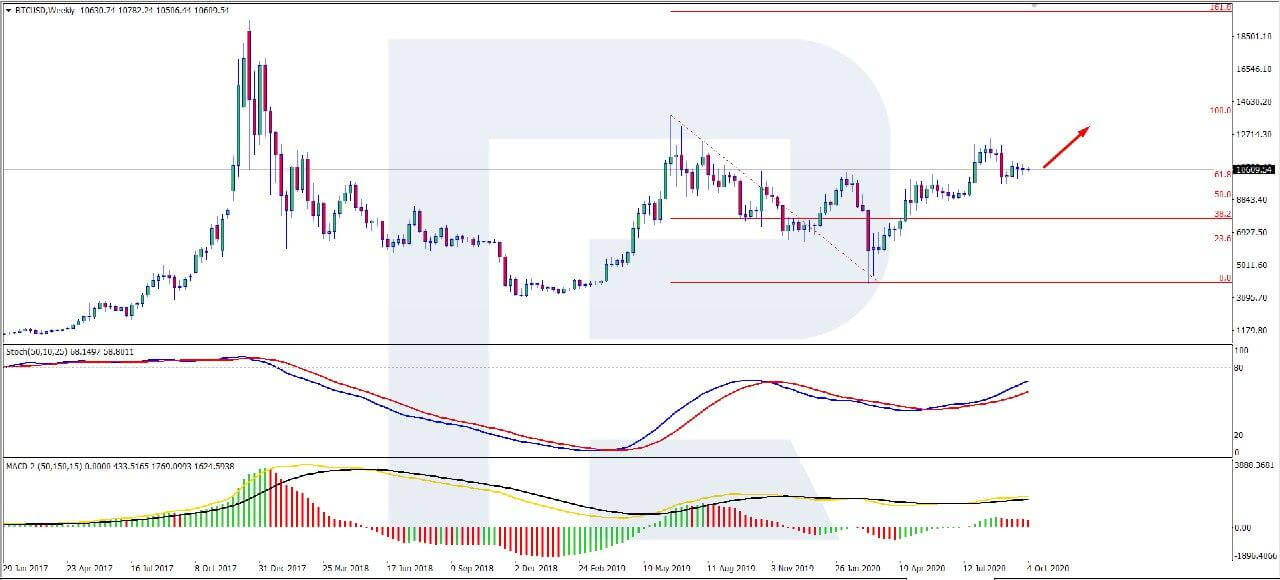
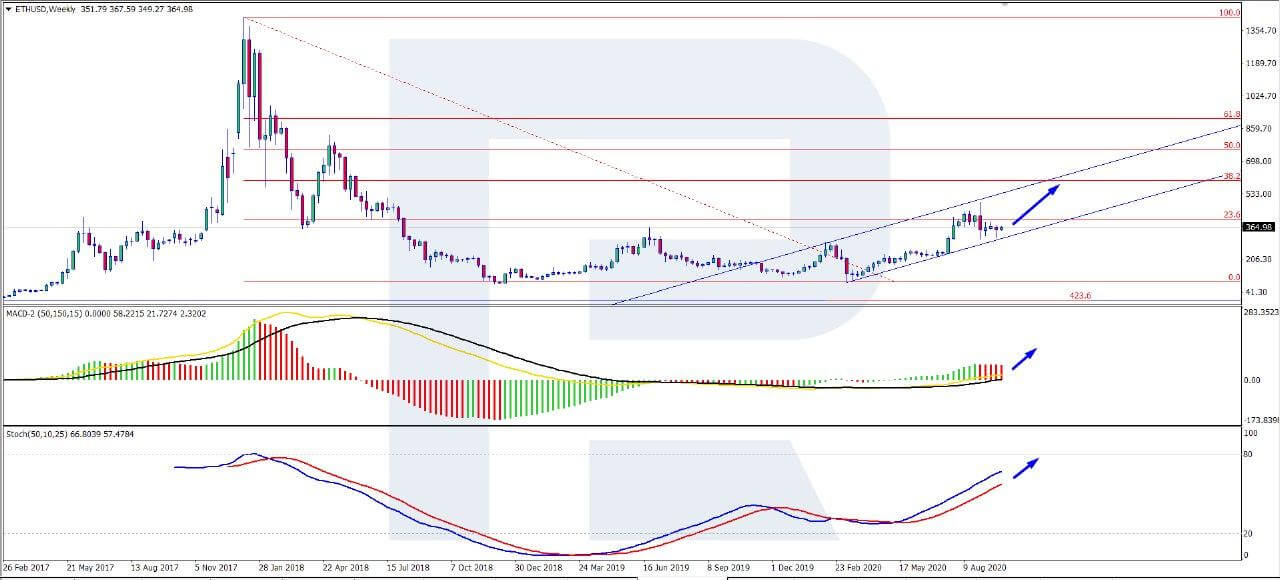
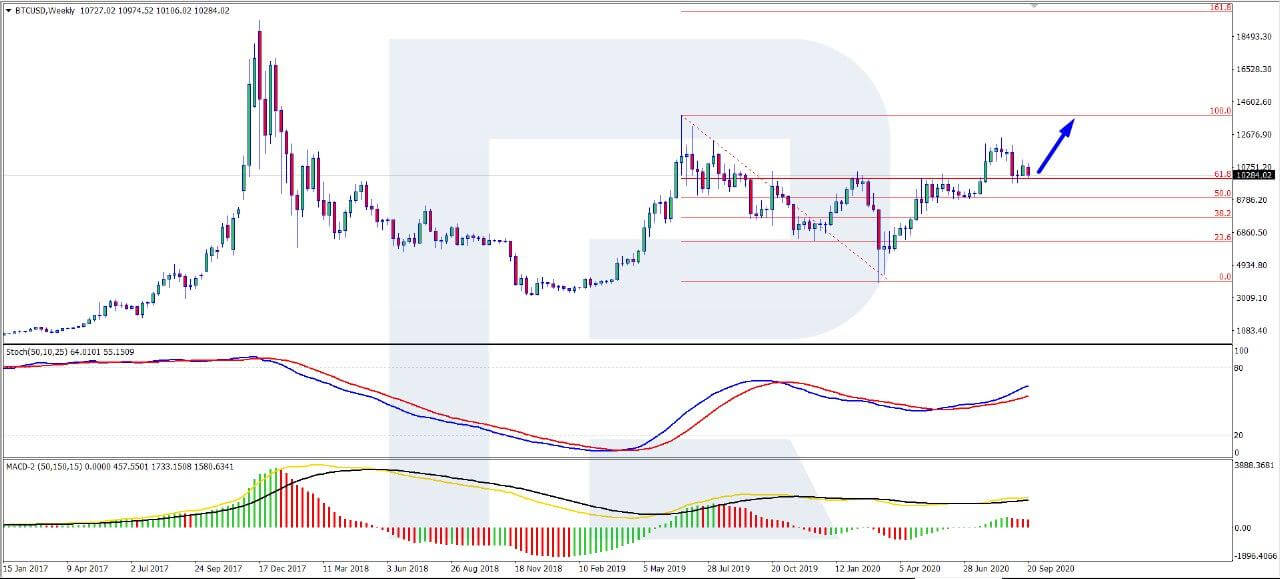
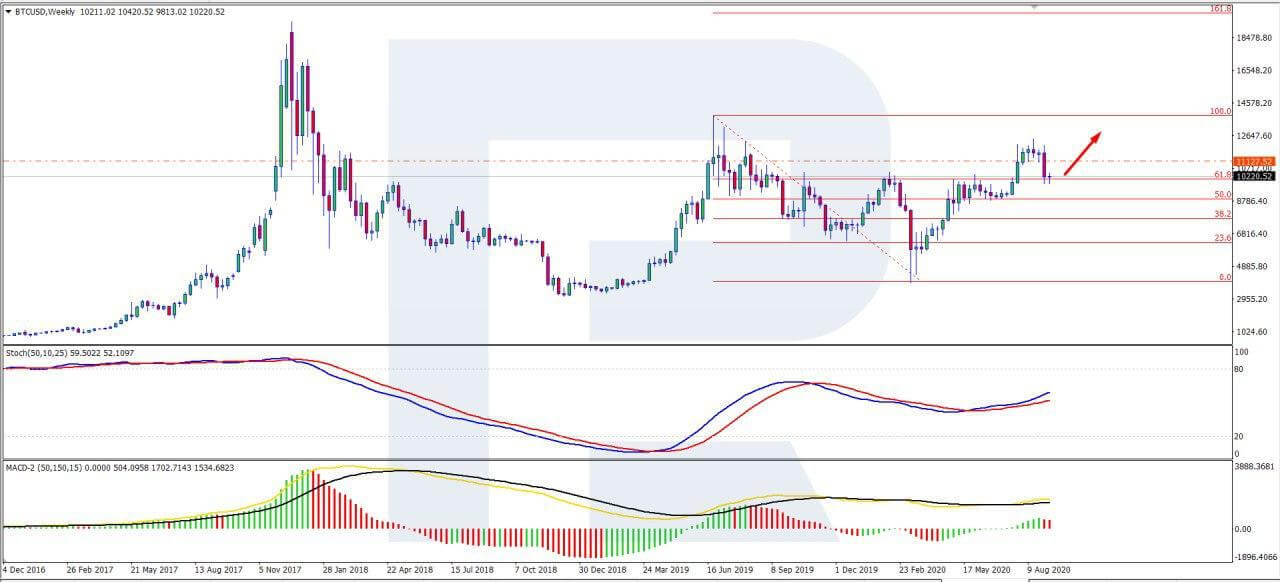
However, even now, on the Bitcoin and Ethereum D1 charts, ascending patterns confirming a leap upwards are forming; note that those are the same patterns. However, there is room for another decline before the patterns are complete. Hence, the market may slump even deeper down before reversing upwards. On W1s of the Bitcoin and Ethereum, big patterns are forecasting large-scale growth; the current decline may be just a classical test of their upper borders, after which the growth will continue.
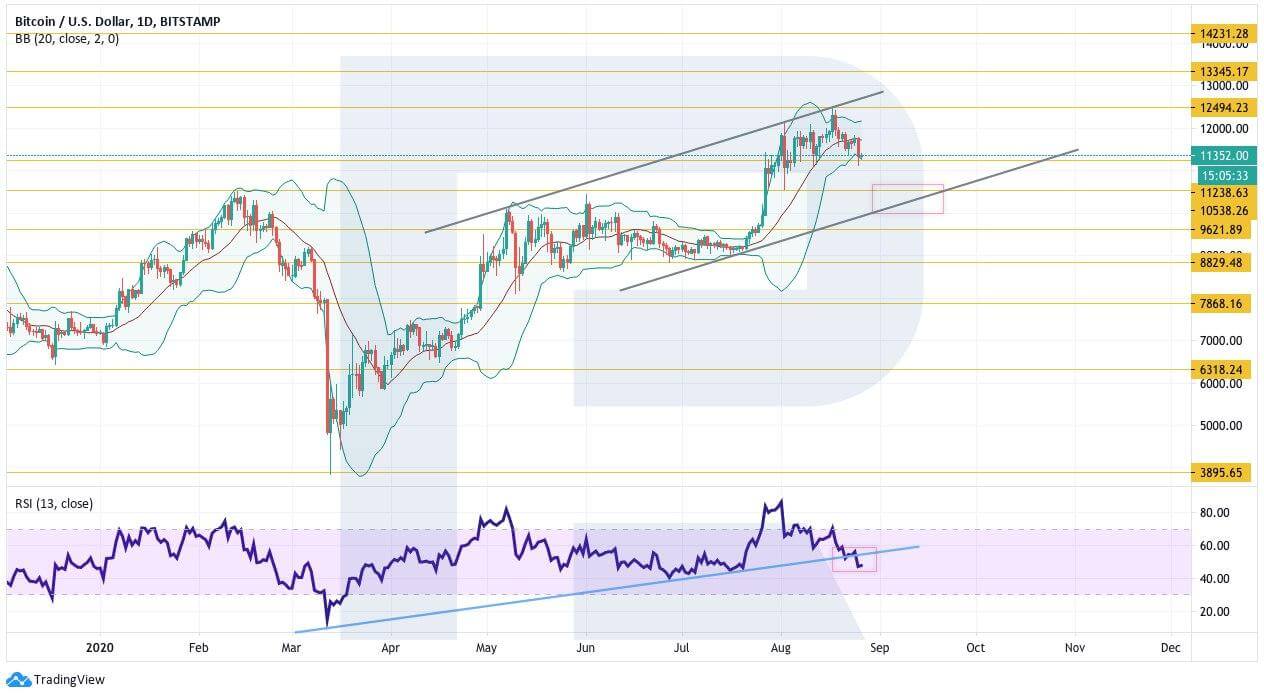
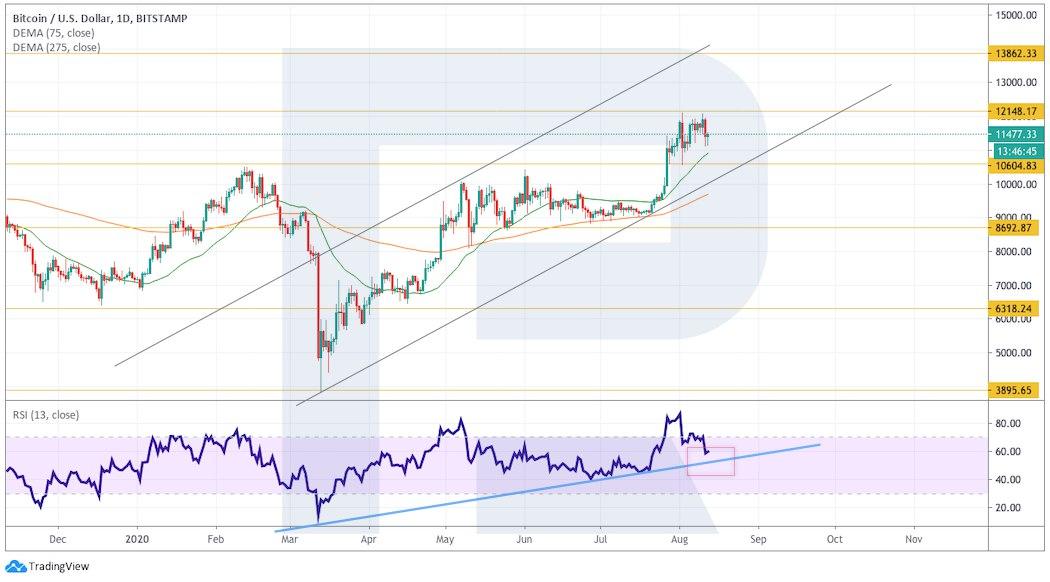
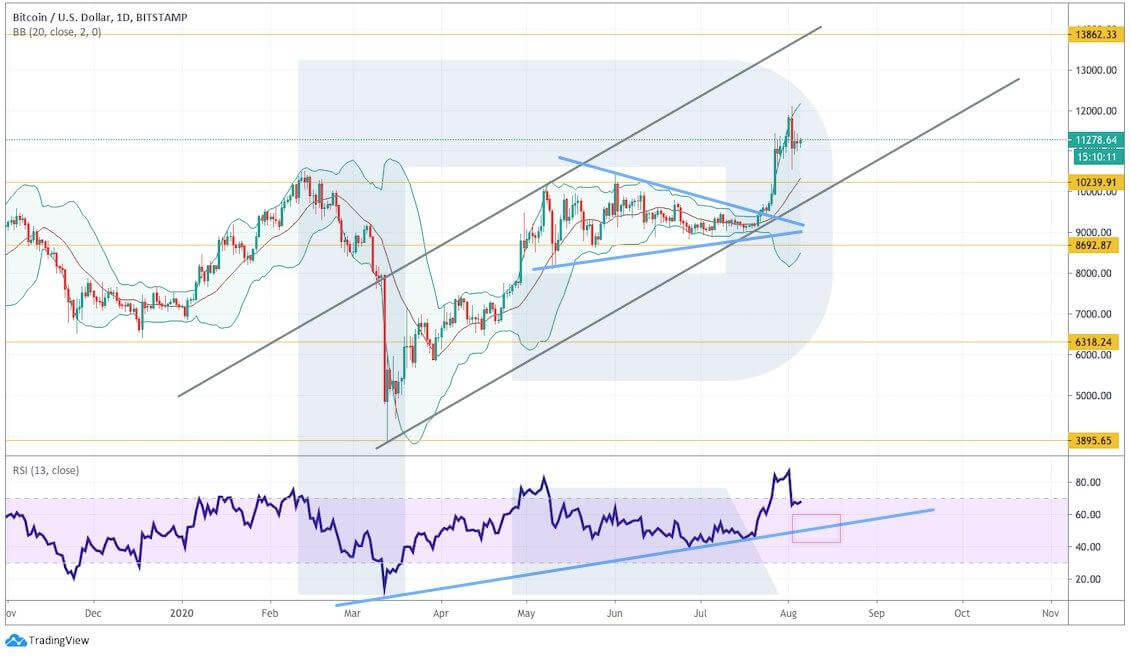
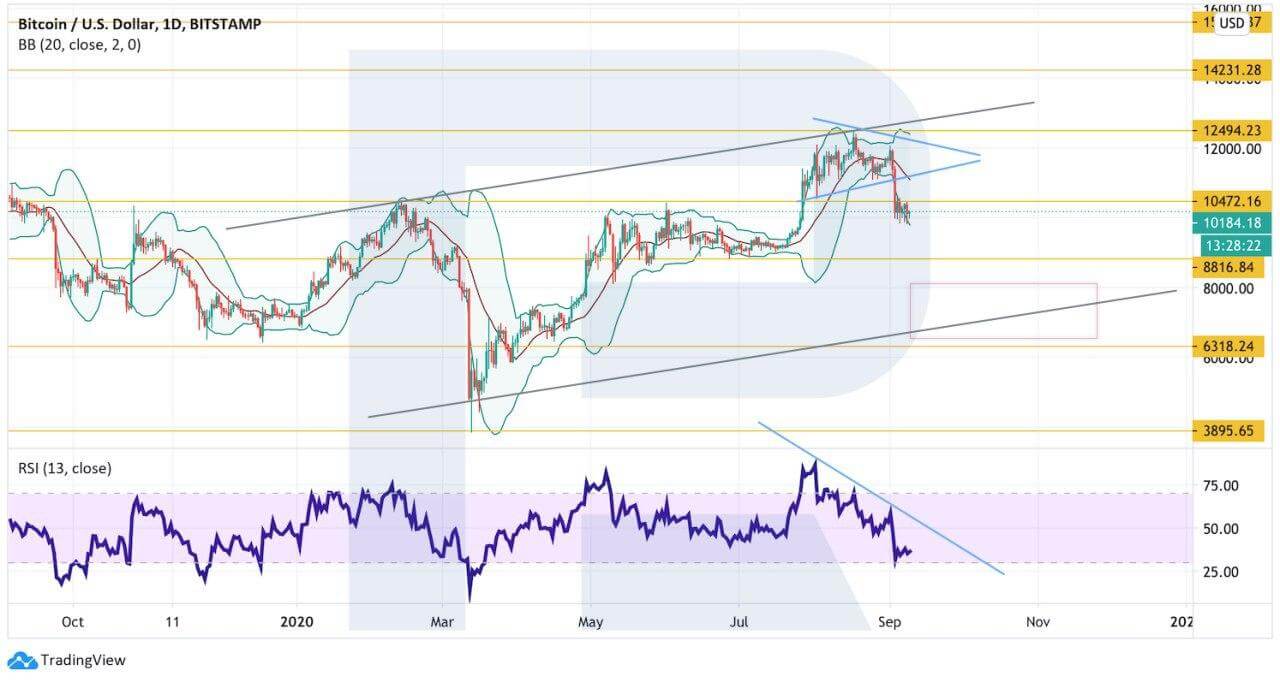
BitcoinOn D1, the Bitcoin decided to go on falling – it broke away the lower border of the Triangle and may easily go down to $8800 and $8000. Near these levels, an ascending 5-0 pattern may complete. Working it off, the cryptocurrency may rise to the local high. A strong signal confirming the growth may be a breakaway of the descending trendline on the RSI. This scenario might be canceled by a breakaway of $6300, after which the Bitcoin may drop below $3895.
Photo: RoboForex / TradingView
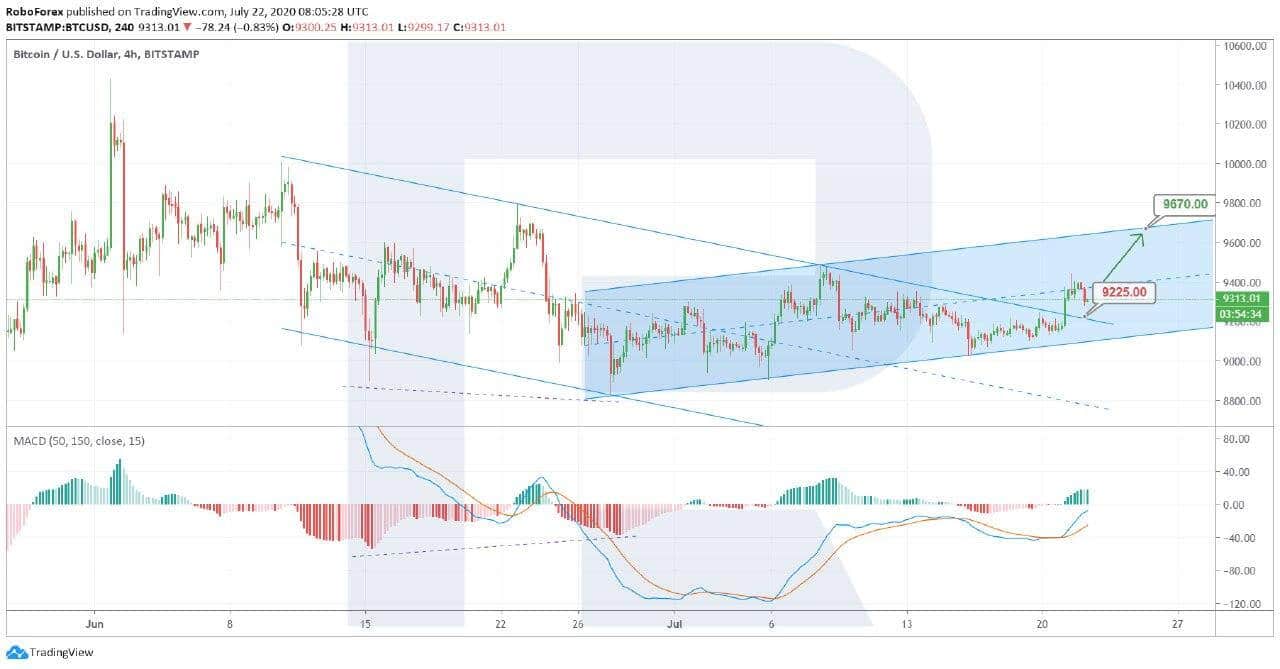
On H4, the price is, again, squeezed inside another Triangle. The quotations may break away the lower border of the pattern and fall further to $8815. An additional signal confirming this forecast will be a bounce off the resistance line on the RSI. The downtrend may be supported by a breakaway of the support area and securing under $9750. The negative scenario may be canceled by a breakaway of the upper border of the descending channel and securing above $10705, in which case the growth may continue to $12495.
Photo: RoboForex / TradingView
EthereumOn D1, ETHUSD demonstrated a steep decline. However, here as well a bullish 5-0 pattern may form. In this case, we should expect a test of the lower border of the ascending channel at $299, followed by further growth up to $500. A strong signal confirming the growth will be a breakaway of the descending trendline on the RSI. The growth may be canceled and the working-off of the bullish pattern will be a breakaway of the lower border of the ascending channel and securing under $245, from where the price may go on falling to $150.
Photo: RoboForex / TradingView
On smaller timeframes, the quotations are squeezed inside a Triangle, though the quotations have already quit the borders of the ascending channel. There is a risk of seeing the quotations fall to $250. The decline may be confirmed by a breakaway of the lower border of the pattern and securing under $302. Another signal confirming such a movement will be a bounce off the upper border of the ascending channel. The scenario may be canceled by a breakaway of the upper border of the pattern and securing above $375, in which case the price might go on growing.
Photo: RoboForex / TradingView
LitecoinOn D1, the quotations are working off a reversal Head and Shoulders pattern. The aim of the decline is $38, where an important support area lies. A breakaway of this area will mean further falling to $25. On the other hand, a strong signal forecasting growth may be rising above the descending trendline on the RSI, which will mean the current descending impulse is nearly over, and the quotations are going to rise to $69.
Photo: RoboForex / TradingView
On H4, the quotations are pushing off the support level of $45. Here, a Triangle pattern is also forming. A breakaway of this pattern will signal further falling to $39. Another signal confirming the decline will be a bounce off the upper border of the descending channel. This scenario may be canceled by a breakaway of the upper border of the descending channel and securing above $50 – then we may expect the quotations to rise to $65.
Photo: RoboForex / TradingView
Bitcoin CashOn D1, the quotations, again, returned to the lower border of the sideways channel. Buyers broke through it upwards confidently but had no vigor to go on. The current price structure reminds very much of a reversal Head and Shoulders pattern forming. Now we should expect a bounce of the quotations upwards to $268. If this area is broken away, the growth may continue to $338, which will mean the reversal pattern will not form, and the growth will go on. Another signal confirming the growth from the current levels is also a test of the trendline on the RSI. The positive scenario may be canceled by a breakaway of $203, which will forecast falling to $139.
Photo: RoboForex / TradingView
On H4, the quotations keep trading inside a Triangle. As the main idea, we expect a breakaway of the lower border of the pattern and falling to $180. Another signal confirming this scenario will be a bounce off the resistance level on the RSI. The falling may be canceled by a breakaway of the upper border of the pattern and securing above $240, in which case the bearish impulse will be over, and the price will start growing to $302.
Photo: RoboForex / TradingView
EOSThe cryptocurrency is testing the support level, as well as the lower border of the ascending channel. There was a potential for a reversal Head and Shoulders pattern to form but sellers do not hurry to take the chance. Moreover: there was a bounce off the support level on the RSI, which means the price tried to reverse and start growing to $3.95. the growth may be canceled by a breakaway of the lower border of the ascending channel and securing under $2.20, which might be followed by a decline to $1.40.
Photo: RoboForex / TradingView
On H4, the asset is declining in a descending channel. The falling will stop with a breakaway of the upper border of the descending channel and securing above $3.17. The growth will be canceled if the price steps over the support area and secures under$2.45 – then the price will go on declining.
Photo: RoboForex / TradingView
Crypto Price Analysis September 9: BTC, ETH, LTC, BCH, EOS
origin »Bitcoin price in Telegram @btc_price_every_hour
ETH/LINK Price Action Candlestick Set (LINKETHPA) на Currencies.ru
|
|
