2020-2-6 19:27 |
Coinspeaker
Crypto Price Analysis February 5: BTC, ETH, XRP, BCH, LTC
Dmitriy Gurkovskiy, a senior analyst at foreign exchange broker RoboForex, provides his vision of the possible tendencies in price changes for Bitcoin as well as for other major cryptos.
Digital assets continue testing their closest resistance levels. Bulls are increasing the pressure and there is a good chance to witness new rising impulses towards the next levels.
Unfortunately, the market hasn’t started a descending correction, thus cancelling formation of reversal patterns on charts of many cryptocurrencies. On one hand, such patterns might have provided bulls with more profitable and conservative options for opening long positions. On the other hand, the market’s unwillingness to correct may indicate an aggressive continuation of growth in the nearest future.
The leading cryptoasset, Bitcoin, is also looking towards updating its local high close to $13,800. If we assume that the current structure is a bullish Flag, then the upside target may be at $17,000. Needless to say, this potential growth of the leading asset is very likely to instigate the same on the entire cryptocurrency market.
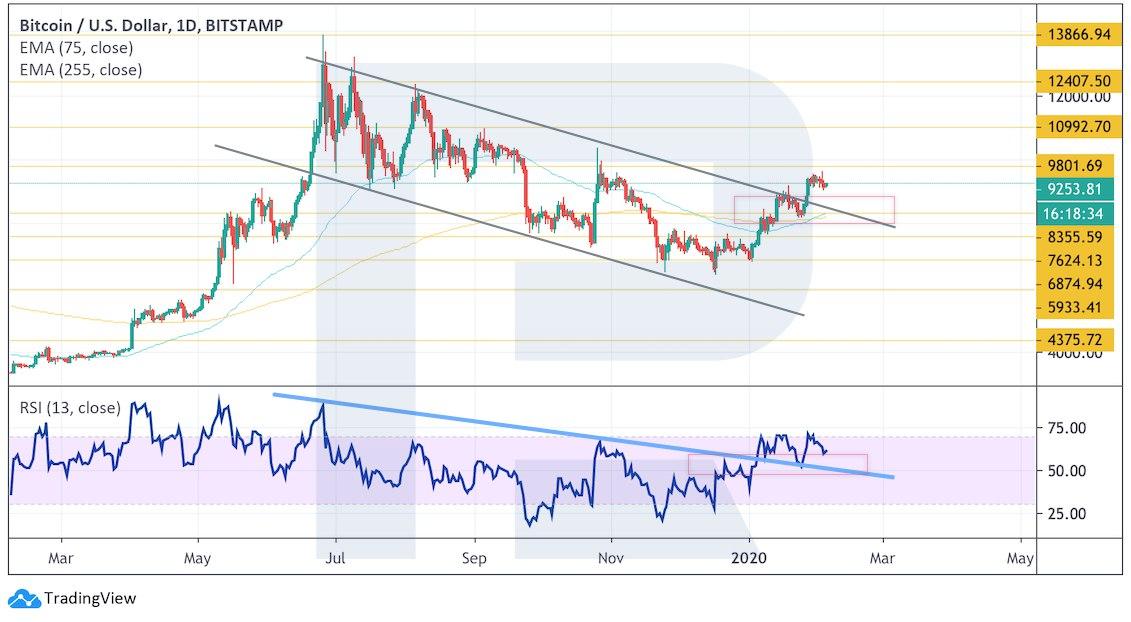
BitcoinIn the daily chart, Bitcoin is once again testing the resistance area close to $9,800. Bulls have already managed to push the price outside the descending channel, but it’s also important for them to fix the asset above the resistance if they want to continue the proper uptrend. A strong signal to confirm the uptrend is an MA Cross in favor of growth. Another test of the broken trend line at the RSI might be the second signal. Moreover, the current structure is looking very similar to a rising Flag, so the upside target, in this case, may be at$17,000. However, if the price rebounds from the current levels, it may start forming an Inverted Head & Shoulders. In this scenario, the downside correctional target will be at $7,625. From this level, one may expect the price to skyrocket. Still, this “skyrocketing” scenario may no longer be valid if the instrument falls lower than $6,875.
Photo: Roboforex / TradingView
In the H4 chart, Bitcoin is rising inside the ascending channel. As we can see, the price already rebounded from MAs in the past, thus indicating pressure from bulls. A strong signal to confirm further growth may be a test of the trend line at the RSI, which indicates a strong support area. However, this “growth” scenario may no longer be valid if the instrument falls and fixes below $8,355, thus indicating that the price is leaving the rising channel to continue the descending correction towards $6,875.
Photo: Roboforex / TradingView
EthereumIn the case of Ethereum, bulls managed to break $180, but couldn’t push the asset higher than $200. As we can see, this level is a strong resistance area, breakout of which will let the price grow towards $260. Before that, the instrument had successfully rebounded from the upside border of the Ichimoku Kinko Hyo Cloud, thus indicating an ascending tendency. Right now, there is a potential of the further uptrend, but we can’t exclude a possibility of the price’s testing the descending channel’s upside border. Another signal in favor of a possible correction is a test of the resistance area at the RSI. However, the “bullish” scenario may no longer be valid if the asset plunges and breaks $155. In this case, the descending tendency may resume.
Photo: Roboforex / TradingView
In the H4 chart, Ethereum is rising inside the channel, but the resistance level is also pretty close. We should expect a slight correction towards the cloud’s upside border and then further growth with the first target at $225. A strong signal will be a rebound from the rising channel’s downside border and a test of the support area at the RSI. To confirm this idea, the asset must break the resistance level and fix above $200. However, if bears manage to push the price below $155, the descending correction will continue; the first target will be at $138.
Photo: Roboforex / TradingView
XRPIn the daily chart, XRPUSD bumped into the descending channel’s upside border near the resistance area. There are risks of a descending correction with a test of the cloud’s upside border. A signal to confirm this scenario is a test of the trend line at the RSI. Also, one shouldn’t exclude a possibility of Inverted Head & Shoulders. In this case, after falling and testing $0.24, the price may skyrocket with the target at $0.42. however, this “bullish” scenario may no longer be valid if the instrument falls lower than $0.18. In this case, the bearish tendency will resume.
Photo: Roboforex / TradingView
In the H4 chart, XRP has just broken the descending channel’s upside border and may continue growing with the first target at $0.32. A strong signal to confirm this scenario is the price’s moving above the cloud, which indicates a bullish impulse and a possible rebound from the support line at the RSI. As we can see, the indicator already rebounded from the line in the past and, as a result, the price moved upwards. However, this scenario may no longer be valid if the asset drops below $0.23. In this case, the price will resume falling towards $0.17.
Photo: Roboforex / TradingView
Bitcoin CashIn the daily chart, Bitcoin Cash is steadily growing; by now, it has broken the descending channel’s upside border. As we can see, the price had been testing this border for several days and managed to resume rising only now. It looks like the next upside target may be at $520. Also, there is an MA Cross in favor of growth. A strong signal to confirm further growth from the current levels is a rebound from the support line at the RSI. However, this scenario may no longer be valid if the price plunges and breaks $315. In this case, the current structure will look like Double Top with the target at $195. To cancel this scenario, the instrument must skyrocket and break $410.
Photo: Roboforex / TradingView
In the H4 chart, the asset is testing the resistance area. Moving Averages also indicate a bullish tendency; the price already rebounded from the area between MAs, which is a signal in favor of bulls. The RSI is stuck inside Triangle, that’s why after the pattern’s upside border is broken, Bitcoin Cash will boost its growth with the first target at $457. However, this scenario may be no longer valid if the instrument falls and breaks $375. In this case, the price may leave the ascending channel and continue falling to reach $315.
Photo: Roboforex / TradingView
LitecoinIn the daily chart, Litecoin has been able to fix above the resistance level. The next resistance area is at $79. As we can see, bears have failed to spark a correction, thus starting to form a reversal pattern, Inverted Head & Shoulders. However, it doesn’t exclude a serious possibility of growth with the target at $100. A good signal in favor of this scenario is a rebound from the broken trend line at the RSI. Still, this scenario may no longer be valid if the instrument breaks the downside border of Bollinger Bands and fixes below $64. In this case, the descending tendency may resume.
Photo: Roboforex / TradingView
In the H4 chart, Litecoin continues growing inside the channel; an important support area is at $64. Another signal to confirm this scenario is a rebound from the support line at the RSI and a test of the rising channel’s downside border. However, this scenario may no longer be valid if the instrument falls and breaks $56. In this case, the price may leave the ascending channel and continue falling with the predicted target at $44.
Photo: Roboforex / TradingView
Crypto Price Analysis February 5: BTC, ETH, XRP, BCH, LTC
origin »Bitcoin price in Telegram @btc_price_every_hour
Ripple (XRP) на Currencies.ru
|
|


