2021-1-26 13:54 |
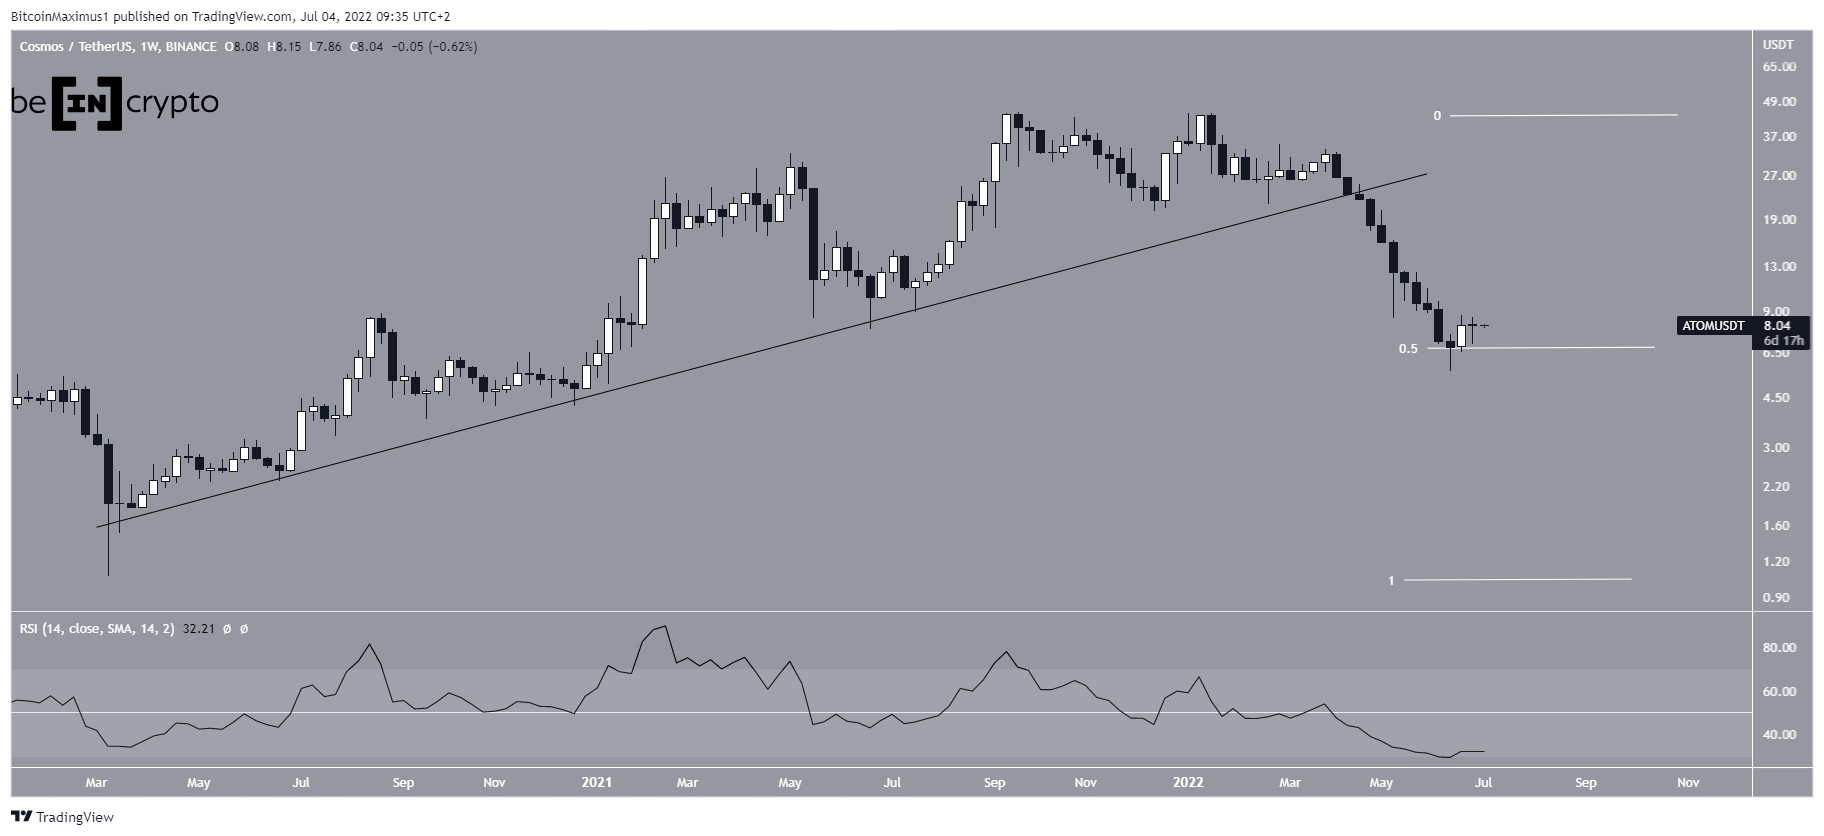
Cosmos (ATOM) reached a new all-time price of $9.20 on Jan. 19 but decreased sharply after. Nevertheless, it’s expected to find support soon and make another breakout attempt.
While the ATOM/BTC pair has broken out from a descending resistance line, the trend cannot be considered bullish until Cosmos reclaims the 25,000 satoshi resistance area.
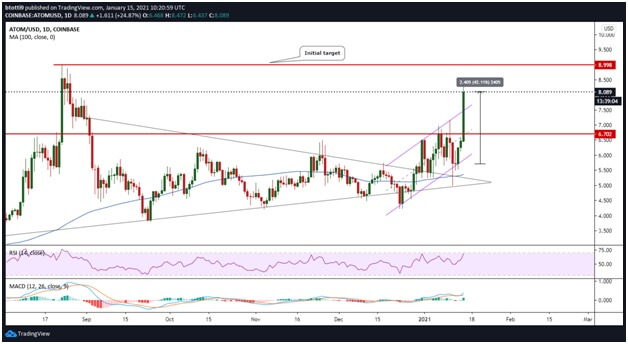
Cosmos (ATOM) All-Time HighOn Jan. 16, ATOM increased above the $8.70 resistance area and proceeded to reach a new all-time high price of $9.20 a few days later on Jan. 19.
However, the higher prices could not be sustained and ATOM has fallen back below the $8.70 area since. This makes the previous breakout just a deviation above the range high.
Technical indicators are neutral, leaning on bearish. It’s not yet clear if ATOM will make another breakout attempt or if it will fall towards the $6.80 support area once more.
ATOM Chart By TradingView Future MovementThe two-hour chart shows that ATOM has reached the 0.618 Fib retracement level of the most recent upward move — a common level for a reversal.
Furthermore, it’s trading inside a descending wedge, which is normally considered a bullish reversal pattern.
However, technical indicators do not yet show any bullish reversal signs.
ATOM Chart By TradingViewThe wave count suggests that ATOM has just completed wave 4 of a bullish impulse (shown in orange) which began on Dec. 22, 2020. The pattern appears to be a fourth wave pullback.
The most likely target for the top of wave 5 is found between $12.40 – $12.77, found by using a combination of external Fib retracements (black) and Fib projections (white and orange).
ATOM Chart By TradingView ATOM/BTCCryptocurrency trader @Postyxbt outlined an ATOM/BTC chart, stating that if it manages to move above the 25,000 satoshi resistance area, ATOM is likely to increase at an accelerated rate.
Source: TwitterThe ATOM/BTC chart shows a breakout from descending resistance line that had been in place since August 2020.
Despite the breakout, ATOM was rejected by the 25,000 satoshi resistance area, which was the previous breakdown level.
Despite technical indicators looking bullish, the trend cannot be considered so until this area is reclaimed.
ATOM Chart By TradingView ConclusionThe ATOM/USD pair is expected to find support soon and make another attempt at moving above its all-time high price.
Despite the breakout from a long-term descending resistance line, the ATOM/BTC trend cannot be considered bullish until it moves above the 25,000 satoshi resistance area.
For BeInCrypto’s latest Bitcoin (BTC) analysis, click here!
The post Cosmos (ATOM) Knocked Back After Reaching All-Time High appeared first on BeInCrypto.
origin »Bitcoin price in Telegram @btc_price_every_hour
Cosmos (ATOM) на Currencies.ru
|
|