2020-7-30 13:00 |
Bitcoin has seen extremely strong performance over recent days, rallying 20% over the past seven days. As of this article’s writing, BTC trades at $11,250, slightly below the local high of $11,500 and above the Tuesday low of $10,600. The asset remains below crucial macro resistance levels despite the breakout. BTC needs to extend higher and hold above certain price points to confirm the next full-blown bull run, some analyses have suggested. Bitcoin Has Room to Rally to Confirm a Bull Market
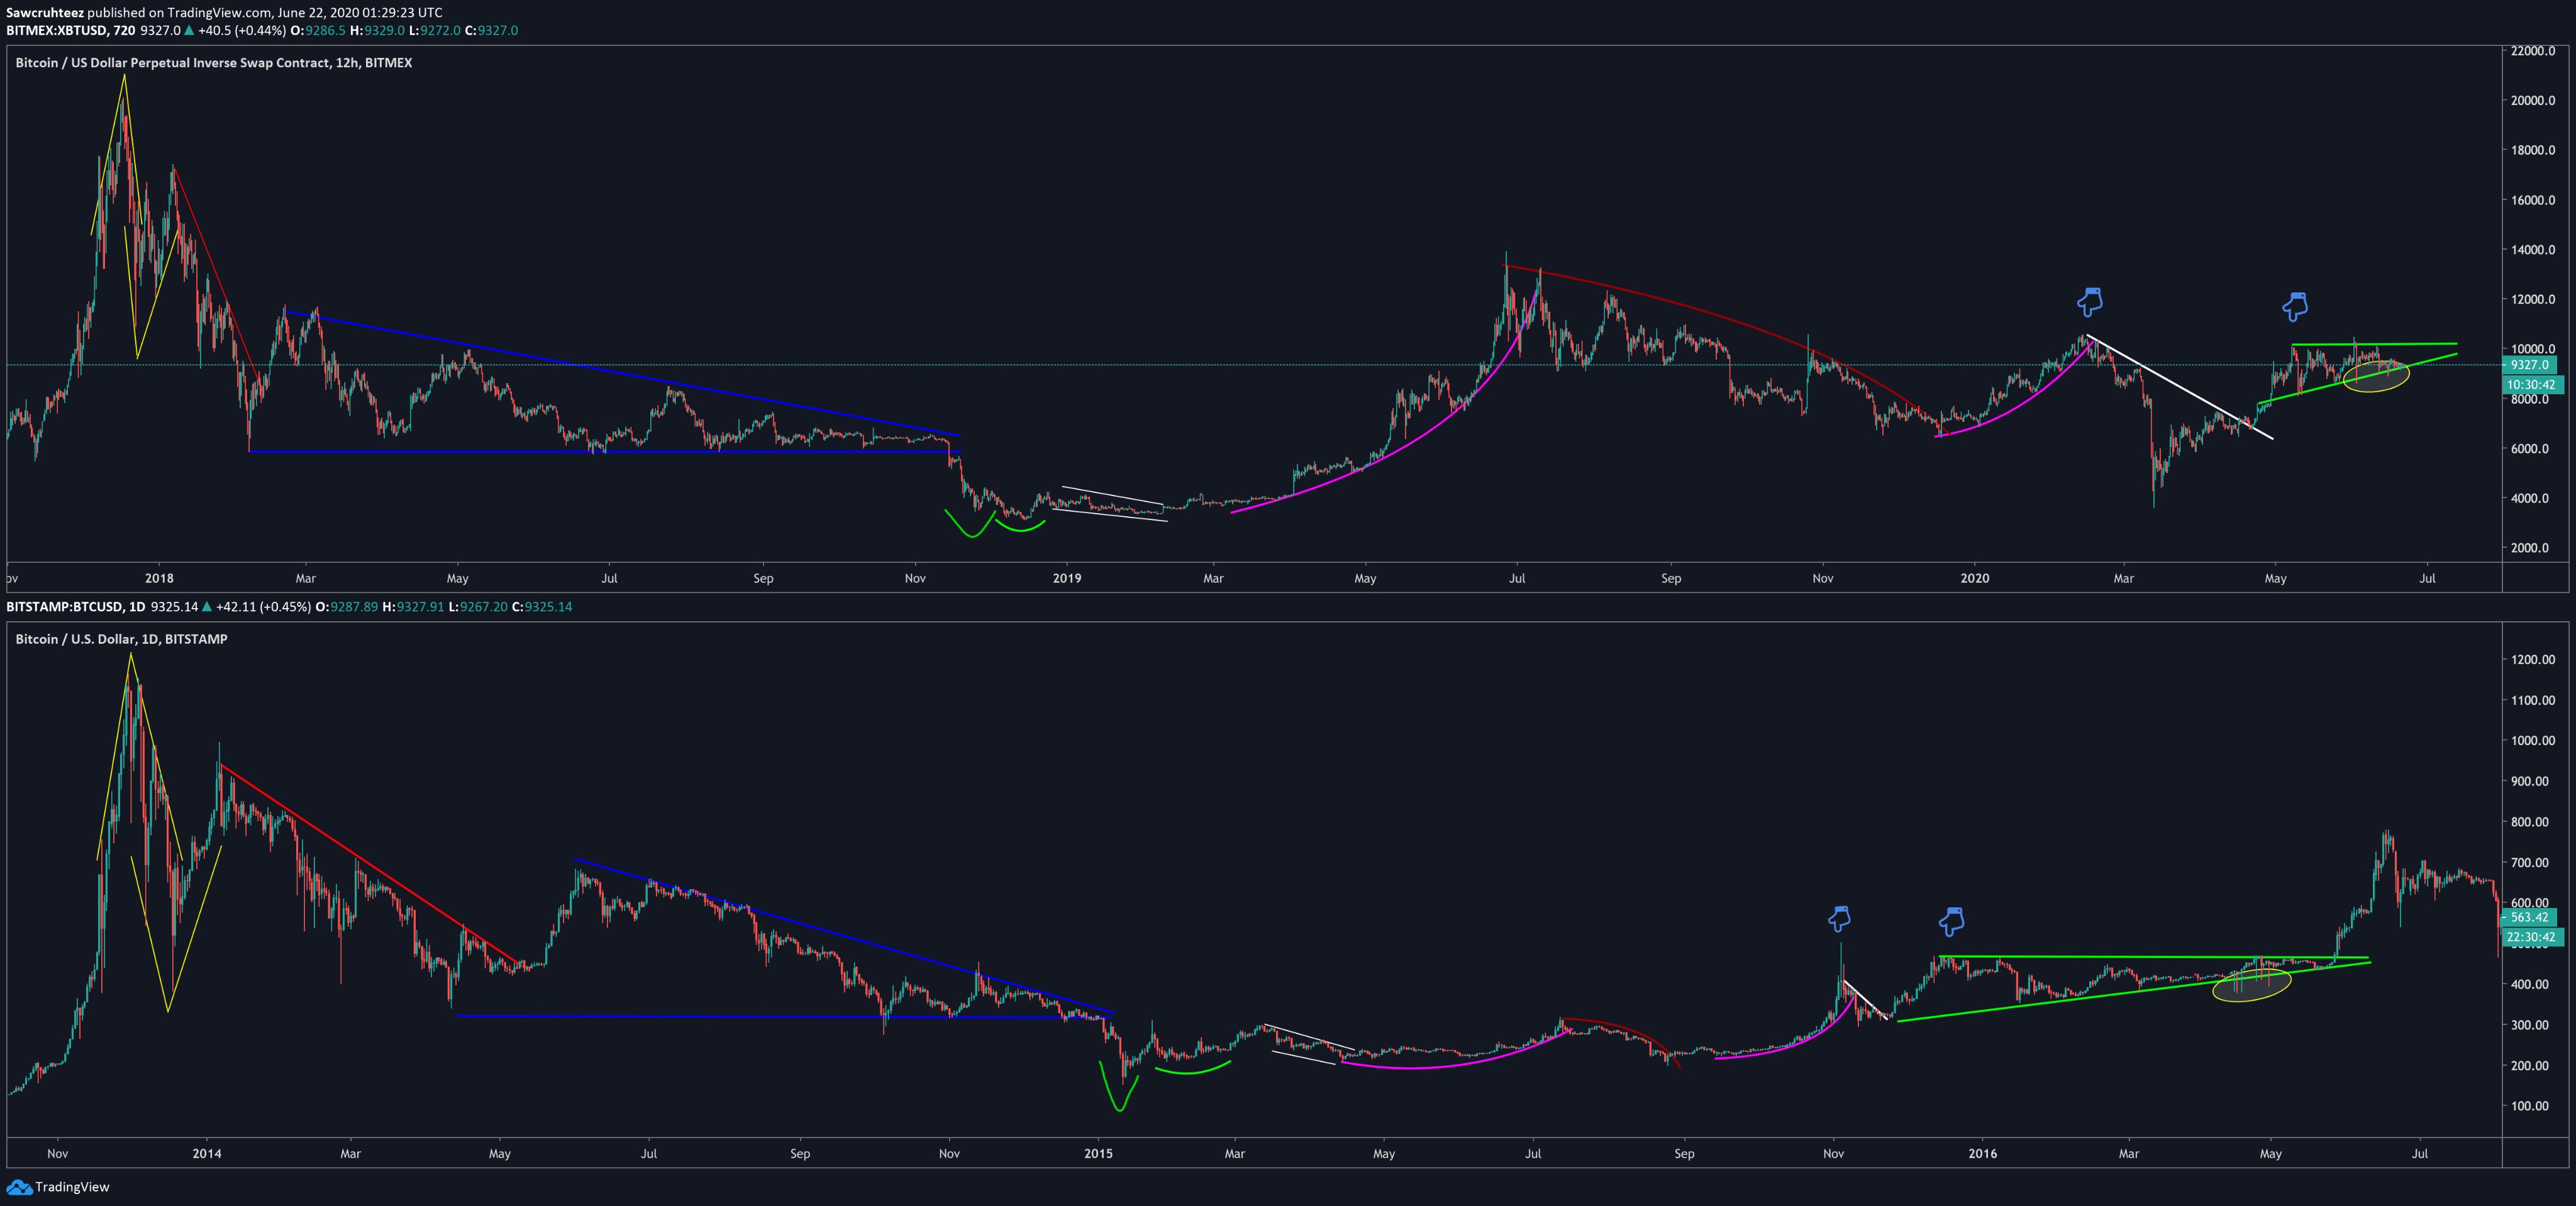
A Bitcoin trader shared the chart below on July 29th, remarking that Bitcoin may still be in a macro consolidation despite the recent rally. “The only long term conservative chart I care about,” he wrote in reference to it.
It shows that Bitcoin has broken above a macro resistance, but remains in a macro consolidation range between $10,000-14,000.
$10,000 is, of course, a pivotal psychological level that many traders watch. And $14,000 is the highs of the bull market in 2019, along with BTC’s closing price at the end of 2017.
Macro BTC price analysis by trader "Emperor" (@emperorBTC on Twitter). Chart from TradingView.comOnce Bitcoin breaks past $14,000, it may enter a period of parabolic advance as it did during the last bull cycle, per the analysis.
The importance of $14,000 to the bull case has been echoed by Rob Sluymer, the chief market technician at Fundstrat Global Advisors. Fundstrat is a Wall Street market research firm that has long been covering the cryptocurrency markets.
In a comment shared with Bloomberg, Sluymer said:
“We remain positive on the overall precise structure for Bitcoin and do expect it push through $10,000-$10,500 as part of its longer term bullish technical profile,” before adding that $13,800 is the next resistance band BTC faces.
$12,000 Is More Important?According to some, though, the importance of $14,000 to Bitcoin may be overstated.
Michael Van de Poppe, a crypto analyst that trades at the Amsterdam Stock Exchange, commented that the bullish threshold for him is “probably $11,600-12,000.” That’s to say, the price region right above the current price action.
“Yes, threshold is probably $11,600-12,000. Lol, well we don’t have any significant levels above that area, so that’s basically the final hurdle before all YouTube influencers are finally going to be right.”
Unfortunately for bulls, there is significant resistance ahead that may halt the rally to $12,000.
One trader shared the chart below on July 30th. It shows that there is approximately $15 million worth of sell orders (on Bitfinex) preventing BTC from moving past $11,500. Data from other exchanges was not shared.
Chart of BTC's recent price action with the order book dominance bands from trader "Coiner-Yadox" (@yodaskk on Twitter). Custom chart from TradingLite. Featured Image from Shutterstock Price tags: xbtusd, btcusd, btcusdt Charts from TradingView.com Conservative Analysis Says Bitcoin Still in "Consolidation" Despite 20% Rally origin »Bitcoin price in Telegram @btc_price_every_hour
Bitcoin (BTC) на Currencies.ru
|
|


