2020-12-31 13:47 |
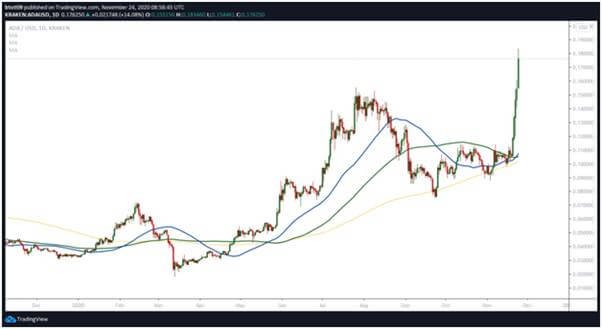
The Cardano (ADA) price is in the process of reaching a weekly close above a long-term resistance level at $0.166, something it has not done since May 2018.
A weekly close above this level would be an extremely bullish development, indicating that Cardano is likely to move higher towards the $0.21-$0.26 range.
Cardano Long-Term Resistance
ADA has been increasing since March when it reached a low of $0.017. The rally stalled once it reached the $0.166 resistance area in July. The area is also the 0.382 Fib retracement level of the most recent downward move.
After an initial rejection, ADA found support and initiated another attempt at breaking out above this level. While it has reached a high above it, it has failed to reach a weekly close higher than this resistance area since May 2018.
If successful in doing so, the next resistance areas would be found at $0.21 and $0.26, the respective 0.5 and 0.618 Fib retracement levels.
Technical indicators are leaning on being bullish. Despite a bearish divergence in the RSI, a drop has already occurred as a result, and the RSI is again moving above 70. A bullish cross in the Stochastic oscillator (highlighted in green) and a weekly close above $0.166 would likely confirm that the trend is bullish.
*Note: The logarithmic chart is used in the image below in order to better visualize large price fluctuations.
ADA Chart By TradingView Future MovementThe daily chart shows that ADA has finally been successful in moving above the $0.172 resistance area, something it had been struggling to do since Nov. 22.
The movement since the breakout resembles a re-test and validation of the area as support.
Technical indicators are bullish, suggesting that ADA is likely to continue moving higher.
ADA Chart By TradingViewThe two-hour chart also shows that ADA is following an ascending support line and is expected to continue increasing as long as it is above this line.
Similar to the daily and weekly time-frames, technical indicators are bullish, supporting the possibility that ADA continues moving higher.
ADA Chart By TradingView ADA Wave CountCryptocurrency trader @theEWguy outlined an ADA chart, which shows the price increasing at an accelerated rate towards $0.40 and potentially even $0.60.
Source: TwitterThe wave count shows that ADA is likely in what appears to be in an extended third cycle wave (shown in white below), while the wave count is given in black.
A likely target for the top of wave 3 is found at $0.29, which would give the 1:3 waves a 1:1.61 ratio — common in bullish impulses.
The most likely scenario is that ADA is in wave 1 of an extended cycle wave 3.
ADA Chart By TradingViewThe sub-wave count for wave 1 is given in orange below and shows that ADA is in sub-wave 5.
A target for the top of the move is found at $0.22, after which a correction is expected.
ADA Chart By TradingView ConclusionWhile a short-term decrease could occur, Cardano is expected to gradually move upwards towards the $0.21-$0.26 range.
For BeInCrypto’s latest Bitcoin (BTC) analysis, click here!
Disclaimer: Cryptocurrency trading carries a high level of risk and may not be suitable for all investors. The views expressed in this article do not reflect those of BeInCrypto.
The post Cardano (ADA) Shoots for Highest Weekly Close Since 2018 appeared first on BeInCrypto.
origin »Bitcoin price in Telegram @btc_price_every_hour
Cardano (ADA) на Currencies.ru
|
|