2020-11-19 15:22 |
If BTC bulls hold the $17,500 area, fresh buy-side pressure could see them retake control and retest resistance at $18,500
After hitting the $18,500 resistance wall on the back of a massive rally this past week, BTC price corrected lower to trade at around $17,709 at the time of writing. But although bears could still push bulls to the lower half of $17,000-$18,000, bulls still have what it takes to battle the negative action.
As the technical picture for Bitcoin suggests, yesterday’s downswing could be just what the market needed to prepare for a fresh upswing.
Bitcoin Price technical outlookYesterday, BTC/USD registered a sharp decline at the $18,500 resistance line, dropping 11% to the $17,800 support level.
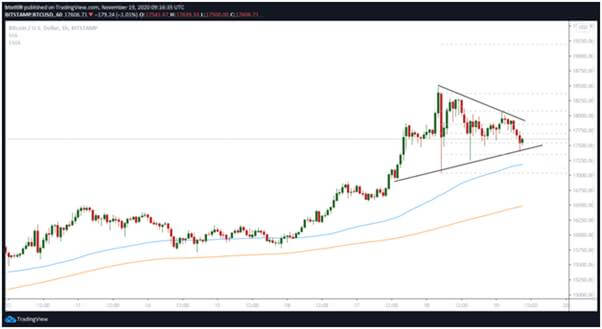
BTC/USD price chart on the 1-hour timeframe: Source: TradingView
As can be seen on the hourly chart above, intraday action includes a swing high to $18,070 and swing low to $17,399. Bulls attempts to retake control have so far fizzled out at around $18,100, with the past several hours seeing prices oscillate between $17,399 and $17,700.
The consolidation being witnessed around this area is therefore good news to the bulls because it means they can target a close above $17,500 on the daily log. Bulls, however, need to follow through with a surge to highs of $18,200.
The technical picture also includes a descending triangle pattern formed on the 1-hour chart. Looking at the chart, we see that the current Bitcoin price is positioned near the 38.2% Fibonacci retracement level of the swing to $17,297 low and $18,109 high. Bulls need to clear the barrier and target the upper boundary of the triangle. The 78.6% Fibonacci retracement offers a barrier to the upside, but what bulls need is a higher close above $17,500.
If this happens, the wringing that likely squeezed out plenty of weak hands when BTC/USD printed a $1,000 red candle yesterday could provide room for a fresh start and a retest of $18.5K. Above this hurdle, a minor wall is expected near $18,800 (61.8% Fib level) before the path opens up for a dash to $19,000.
On the downside, the triangle pattern on the 1-hour chart suggests the lower trend line and the 23.6% Fibonacci retracement level ($17,349) provides support.
But a breakdown below the lower trendline of the contracting triangle could see prices drop to the $17,000 support level. Buyers must defend it to prevent further damage that is likely to send BTC/USD to the 200-SMA ($16,494).
The post Bulls look to retake $18,000 after 10% fall in BTC price appeared first on Coin Journal.
origin »BullshitCoin (BULLS) на Currencies.ru
|
|


