2021-5-29 20:30 |
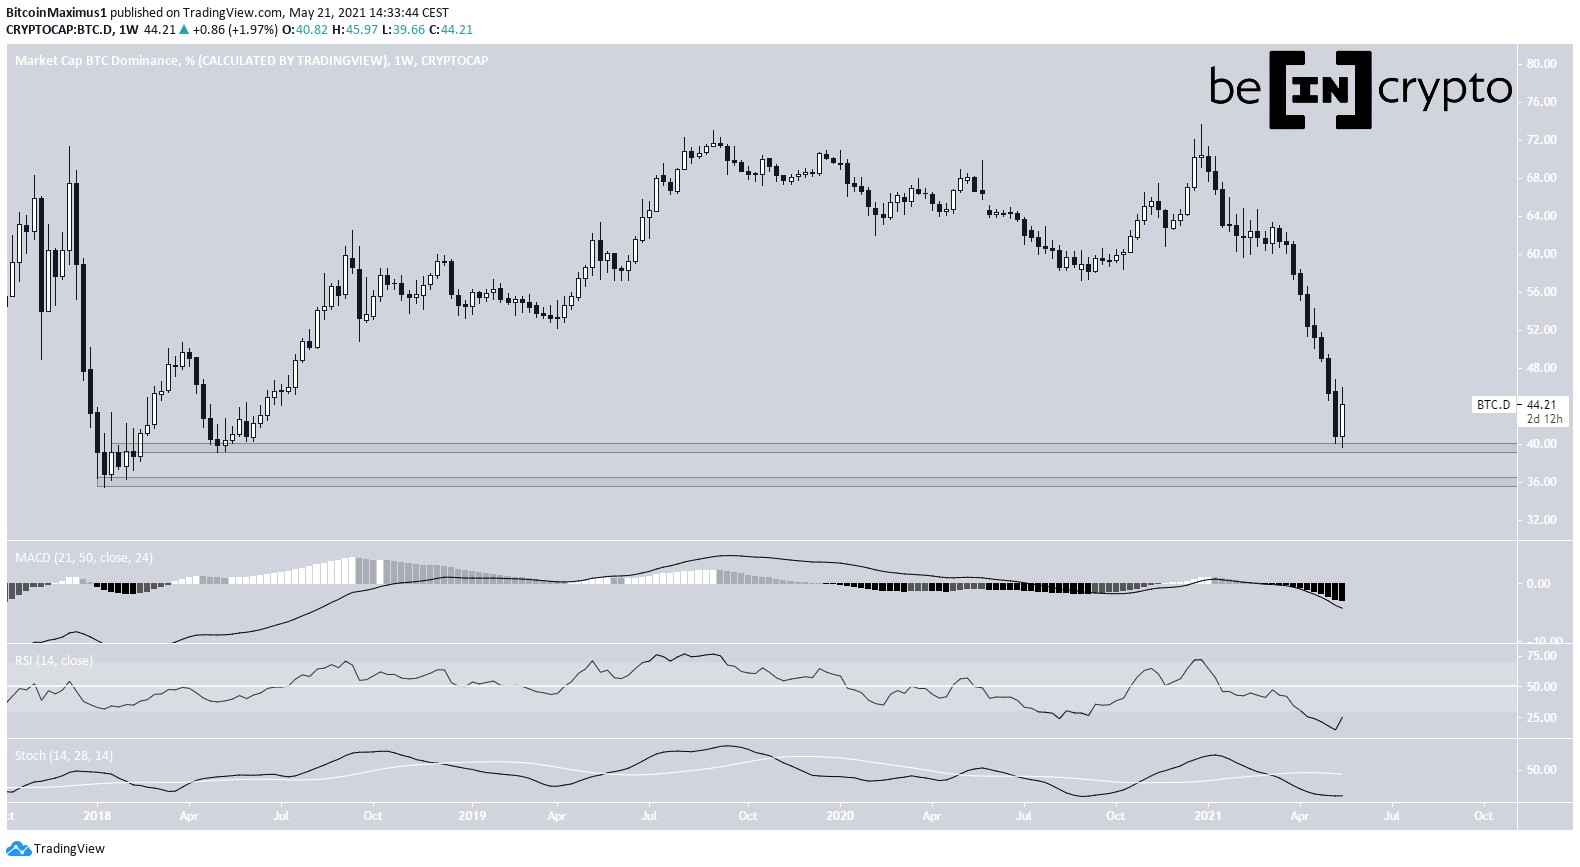
The Bitcoin Dominance Rate (BTCD) has been decreasing alongside a descending resistance line since Jan. 3, 2021.
While it bounced on May 19, it has been decreasing since reaching a high of 48.67%, on May 23.
BTCD resistance lineBTCD has been following a descending resistance line since Jan. 3, 2021. The line caused a rejection on March 24, leading to an accelerated downward movement.
On May 19, BTCD settled on a low of 39.66% and bounced considerably, leading to a high of 48.67%, four days later. However, it failed to reach the resistance line and has been moving downward since.
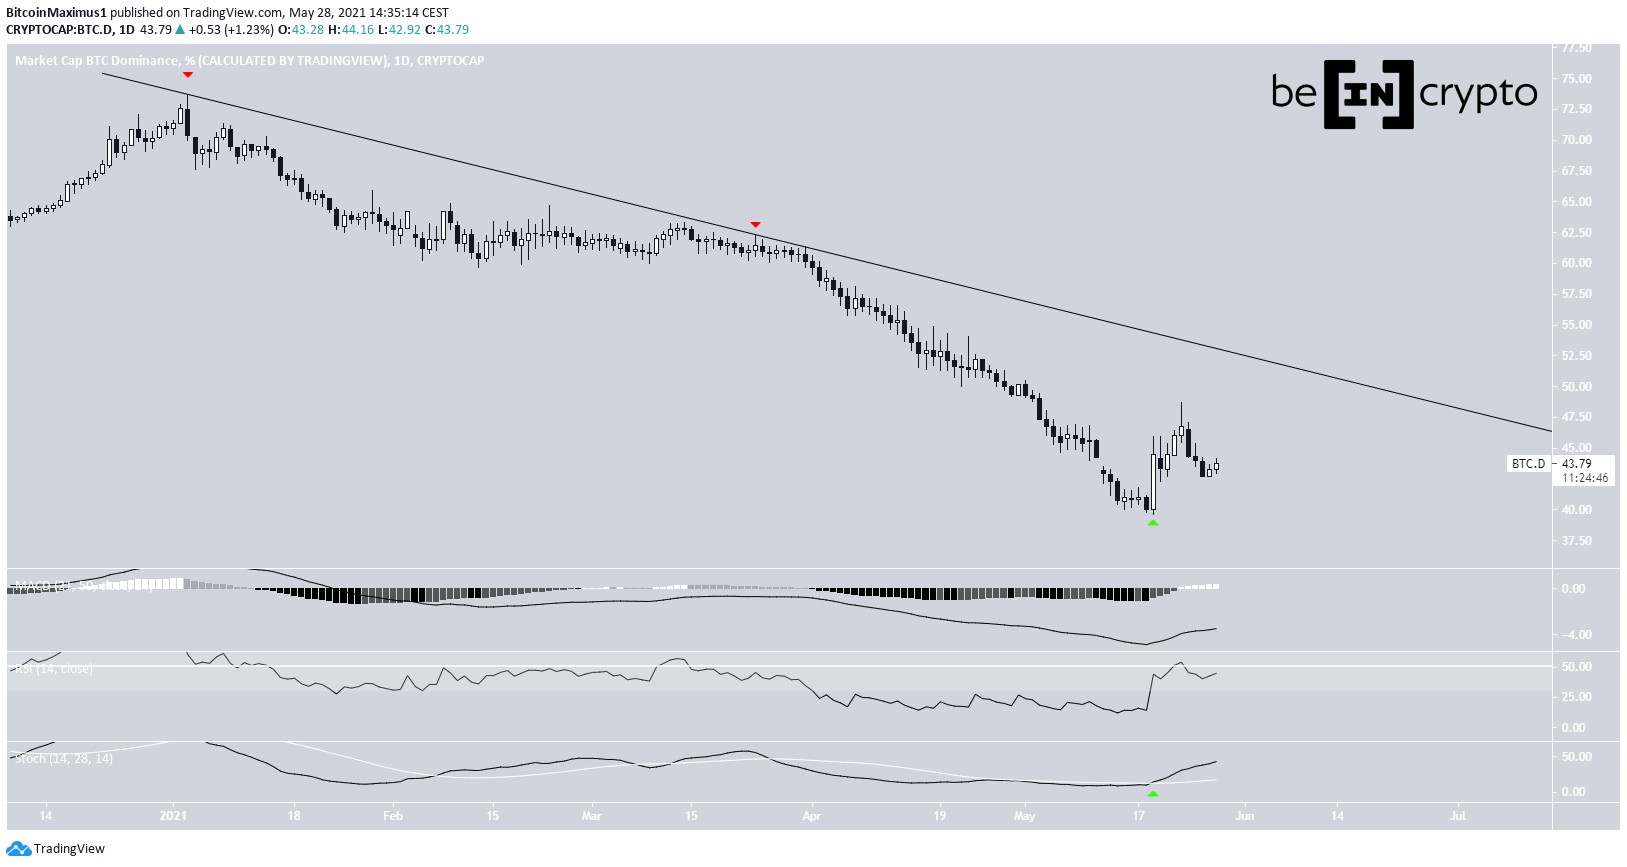
Technical indicators are showing bullish signs. The Stochastic oscillator made a bullish cross (green icon) and the MACD histogram is increasing. However, the signal line is still below 0 and the RSI is below 50.
Therefore, the bullish reversal is not confirmed yet.
Chart By TradingViewCryptocurrency trader @TheEuroSniper outlined a BTCD chart, stating that he expects a bounce towards the 50% area, before another fall towards a new all-time low. As seen above, the bounce has already transpired and BTCD has been decreasing since May 23.
Source: Twitter Future BTCD movementThe bounce after the May 19 lows looks like a three wave corrective structure. Furthermore, the ensuing downward movement looks impulsive (highlighted in red).
Therefore, it is possible that after a push to resistance at 44.9% or 46.26%, BTCD gets rejected and continues falling towards a new all-time low.
This would also fit with the longer-term count.
Chart By TradingViewThe relationship between bitcoin (BTC) and BTCD has been negative since May 19. Therefore, an increase in the BTC price causes a decrease in BTCD (highlighted in red) and vice-versa (highlighted in green).
Chart By TradingView Altcoin market capThe altcoin market cap has fallen significantly, over the past two weeks. In addition, it created an evening star pattern, which is considered a bearish reversal pattern.
Technical indicators are mixed. The RSI has generated hidden bullish divergence and bounced above the 50 line. Despite this, the MACD has created a lower momentum bar.
Chart By TradingViewThe shorter-term six-hour chart shows a descending resistance line in place since the all-time high on May 12. The line coincides with the 0.618 Fib retracement resistance level.
Whether a breakout or a rejection occurs will determine the direction of the long-term trend.
Chart By TradingViewFor BeInCrypto’s latest bitcoin (BTC) analysis, click here.
The post BTCD Resumes Downtrend, After Strong Bounce appeared first on BeInCrypto.
origin »Bitcoin price in Telegram @btc_price_every_hour
BitcoinDark (BTCD) на Currencies.ru
|
|