2020-10-29 23:00 |
The Bitcoin Dominance Rate (BTCD) has broken out from a bullish reversal pattern and reclaimed an important horizontal level.
While BTCD is likely to increase towards the long-term descending resistance line outlined below, a breakout is required for the long-term trend to remain bullish.
Pattern BreakoutOn Sept 2, the BTCD reached a low of 57.51% and began to rally. In doing so, it created an inverse head and shoulders (IH&S) pattern, which is a bullish reversal signal.
The rate broke out on Oct 11 (red arrow in the image below) and has been increasing since. Today, it broke out from the 62.5% area, which had been acting as resistance, and continued to rally.
The closest resistance area is 64.2%, while the 62.5% area is now likely to act as support.
BTCD Chart By TradingView
Despite the breakout and reclaim of resistance, the shorter-term chart has begun to show weakness. Both the RSI and the MACD have formed bearish divergence, the former being well inside its overbought region. Furthermore, the rate has created what resembles a double top pattern, which is usually bearish.
If the price retraces, it should find support near 61%, the most recent short-term high from which the rate broke out, and an ascending support line drawn from the Sept 14 lows.
BTCD Chart By TradingView
Long-Term MovementCryptocurrency trader @damskotrades outlined a Bitcoin dominance chart, outlining an increase all the way to 66%, before a sharp drop that eventually takes the rate towards 52%.
Source: Twitter
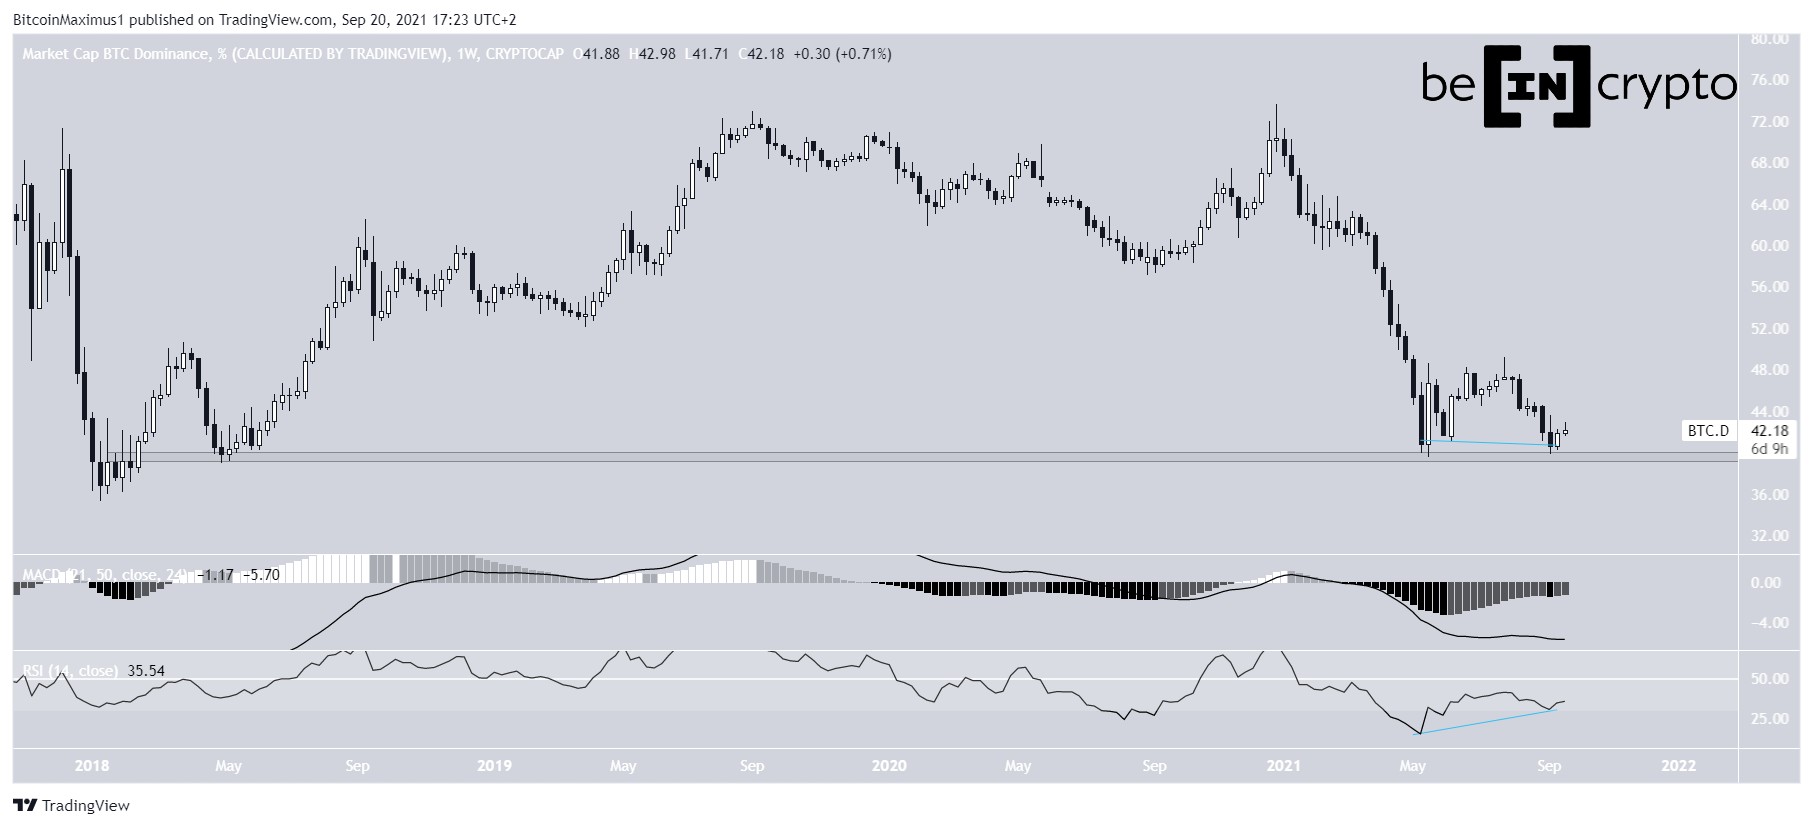
The weekly chart aligns with this assessment. BTCD is in the process of moving above the 62.5% area and approaching the descending resistance line drawn from the Aug 2019 highs, which is currently at 66%.
A rejection from the line followed by a fall would fit with the pattern of lower highs, which have been in place since August.
Despite the purported breakout, technical indicators have not yet turned bullish. While both the MACD and RSI are increasing, the former has not yet crossed into positive territory, and the latter has not confirmed a move above 50. Furthermore, the Stochastic Oscillator has not made a bullish cross.
Therefore, until BTCD successfully breaks out above the descending resistance line, we cannot confidently state that the long-term trend is bullish.
BTCD Chart By TradingView
To conclude, while BTCD is likely to increase towards 66% in the mid-term, a breakout from the long-term descending resistance line is required for the long-term trend to turn bullish.
For BeInCrypto’s previous Bitcoin analysis, click here!
Disclaimer: Cryptocurrency trading carries a high level of risk and may not be suitable for all investors. The views expressed in this article do not reflect those of BeInCrypto.
The post BTCD Breaks Out But Has Yet to Clear Long-Term Resistance appeared first on BeInCrypto.
origin »BitcoinDark (BTCD) на Currencies.ru
|
|


