BNB Price Rally Imminent? Trendline Break Could Ignite Surge To $635

BNB Price Rally Imminent? Trendline Break Could Ignite Surge To $635
фото показано с : newsbtc.com

2024-7-17 14:00

Currently, the price of BNB has been attempting a bullish momentum movement toward the bullish trendline. This bullish move which is the second attempt the crypto asset is making after a successful break below the trendline is sparking up optimism among traders and investors alike that a break above could ignite a potential rally toward the $635 resistance mark.

As BNB’s bullish sentiment continues to build, this article aims to analyze its current price actions and technical indicators pointing toward sustained growth to provide readers with adequate insight into BNB’s potential future actions.

BNB’s price is currently trading at around $580, up by 4.15% with a market capitalization of over $85 billion and a trading volume of over $1 9 billion as of the time of writing. In the last 24 hours, there has been a 24-hour increase of %3.82 in BNB’s market capitalization and a 7.89% decrease in its trading volume.

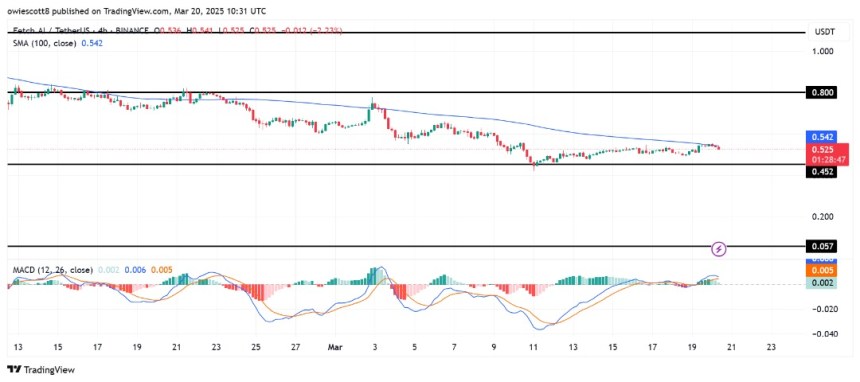
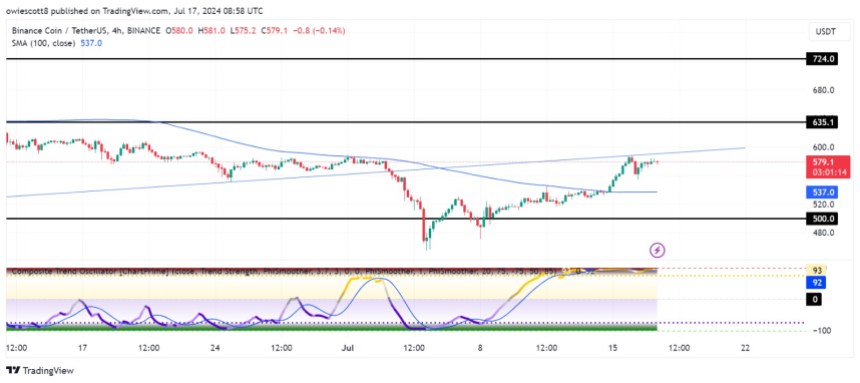
Technical Analysis: Key Trendline And A Potential Rally In Focus

Currently, the price of BNB on the 4-hour chart is trading above the 100-day Simple Moving Average (SMA), attempting an upward move toward the bullish trendline. It can also be observed here that the price of the crypto asset has previously attempted a move on the bullish trendline but enchanters a pullback, which has risen again for a retest.

The 4-hour Composite Trend Oscillator also suggests that the crypto asset may potentially sustain its positive sentiment toward the bullish trendline and aim for the $635 resistance level as the signal line and the SMA of the indicator are still trending in the overbought zone and no cross-over attempt has been made.

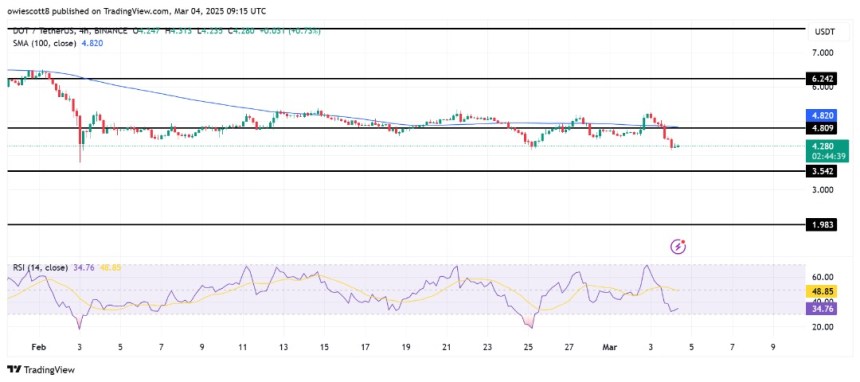
On the 1-day chart, the price of BNB is bullish and is attempting a move towards the 100-day SMA and the bullish trendline. Although the crypto asset is still trading below the 100-day SMA, with the momentum the price is building, it could potentially break above the trendline and continue to rise toward the $635 resistance level.

Finally, it can observed that the signal line has crossed above the SMA of the indicator and are both attempting a move out of the oversold zone. With this formation, it can be suggested that BNB may experience more price growth.

Future Outlook: What Lies Beyond For BNB?

BNB is currently attempting a bullish move toward the bullish trendline. If the crypto asset breaks below the bullish trendline, it may start a rally toward the $635 resistance level. A break above this level may trigger a more bullish move for BNB to test the $724 resistance level and other lower levels.

However, if the price of BNB fails to break above the bullish trendline and begins to drop again, it will start to move toward the $500 support level. It could potentially undergo a further drop toward the $357 support level and other lower levels if there is a breach below the $500 support point.

origin »

Binance Coin (BNB) на Currencies.ru

$ 581.48 (-0.45%)
Объем 24H $2.367b
Изменеия 24h: 1.06 %, 7d: -3.30 %
Cегодня L: $572.1 - H: $585.9
Капитализация $82.847b Rank 5
Доступно / Всего 142.475m BNB

break trendline bullish 635 bnb could toward

break trendline → Результатов: 37


Dogecoin Price Jumps By 23% – Meme Coin Hype Back In Full Swing?

Dogecoin (DOGE) has recently experienced a rollercoaster ride. For over a week, its price struggled to break through the $0. 063 resistance level, leaving investors uncertain about its future.   However, there is a glimmer of hope as DOGE has managed to rebound from the support trendline of a channel pattern, sparking renewed interest and increasing accumulation pressure among investors.

2023-6-22 10:03


Фото:

Bitcoin Breaks Below Key Bullish Trendline as Analysts Eye Move to $18,400

Bitcoin has been showing some serious signs of strength throughout the past few days and weeks Bulls have been in full control of the cryptocurrency’s price action, but are starting to lose their edge over bears as the crypto drifts lower Where it trends in the mid-term will depend largely on whether or not buyers can defend against a break below $18,600 One trader is pointing to this as the first key support level it […]

2020-12-9 21:00


Bitcoin Just Broke a Descending Trendline from 2017; Is the Bull Market Here?

It has been a wild 24-hours for Bitcoin and the aggregated cryptocurrency market Following a long-held bout of consolidation, the benchmark digital asset is now breaking out and appears to be aiming for a test of its yearly high at $10,500 BTC’s latest break above $10,000 is different from those seen previously and has so far proven to be far more sustainable Analysts are now noting that this movement has also allowed Bitcoin to shatter […]

2020-7-28 21:00


Фото:

Top Macro Investor Claims the Time for a Bitcoin Rally is Almost Here

Bitcoin is currently attempting to break above the resistance that has been formed at $9,300 This comes on the heels of a nearly week-long consolidation phase between $9,000 and $9,300 Where it trends next will likely depend on its reaction to this level, and some analysts are expecting the next movement to favor bulls heavily One top macro investor is explaining that BTC is on the cusp of breaking above a crucial descending trendline He […]

2020-7-9 21:00


Фото:

Bitcoin’s Bull Case Remains Valid as Buyers Fight to Maintain $9,000

Bitcoin has been flashing some overt signs of weakness throughout the past several days and weeks This has been rooted largely in its inability to break into the $10,000 region after facing multiple strong rejections here throughout the past several days Analysts are now noting that the cryptocurrency remains in a position to see further upside, however, as long as it is able to hold above a key ascending trendline It also could soon rally […]

2020-5-23 02:00


Фото:

Bitcoin Just Broke Its Short-Term Downtrend; Here’s How High It Could Rally

Bitcoin was finally able to recapture its position above $9,000 after an extended period of trading beneath this level The cryptocurrency now appears to be gearing up for a big push higher as it maintains a firmly bullish market structure This bullishness could be further bolstered by its recent ability to break above a descending trendline that had previously been guiding it lower After making multiple attempts to break back above $9,000, Bitcoin buyers were […]

2020-5-14 02:00


ChainLink (LINK) Price Analysis and Prediction 2019 – All Bullish Confirmations You Can Hope For (Mid May Update)

Mid May Update: Technicals LINKBTC looks very good on the daily timeframe. Link managed to break the EMA200 and two resistances: horizontal at 9473 sats and ascending trendline at 10330; it is now testing the Fib 618 level and will probably take a breather here before marching further to the 12477 satoshis level and Fib […] The post ChainLink (LINK) Price Analysis and Prediction 2019 – All Bullish Confirmations You Can Hope For (Mid May Update) appeared first on CaptainAltcoin.

2019-5-12 01:40


Фото:

Bitcoin Price Analysis: Potential Reaccumulation Could Test Bear Trend

Last week, after a devastating move that shook the market violently up and down for a 7% move in just a few short minutes, bitcoin saw a major sign of strength as it proceeded to have a slow, but steady markup where it managed to establish a local high in the $6,800s:Figure 1: BTC-USD, Hourly Candles, Shakeout Prior to MarkupThis shakeout forced the market to temporarily establish a new monthly low in what could be argued to be a stop-hunt prior to the move to the $6,800s.

2018-9-24 21:29