2019-6-11 17:00 |
Bitcoin [BTC], the world’s largest cryptocurrency, has been on a path to prove all its doubters wrong with its consistent price surges and market cap gains. Other factors in the Bitcoin ecosystem have also improved, with market momentum and the 200-week moving average showing green numbers.
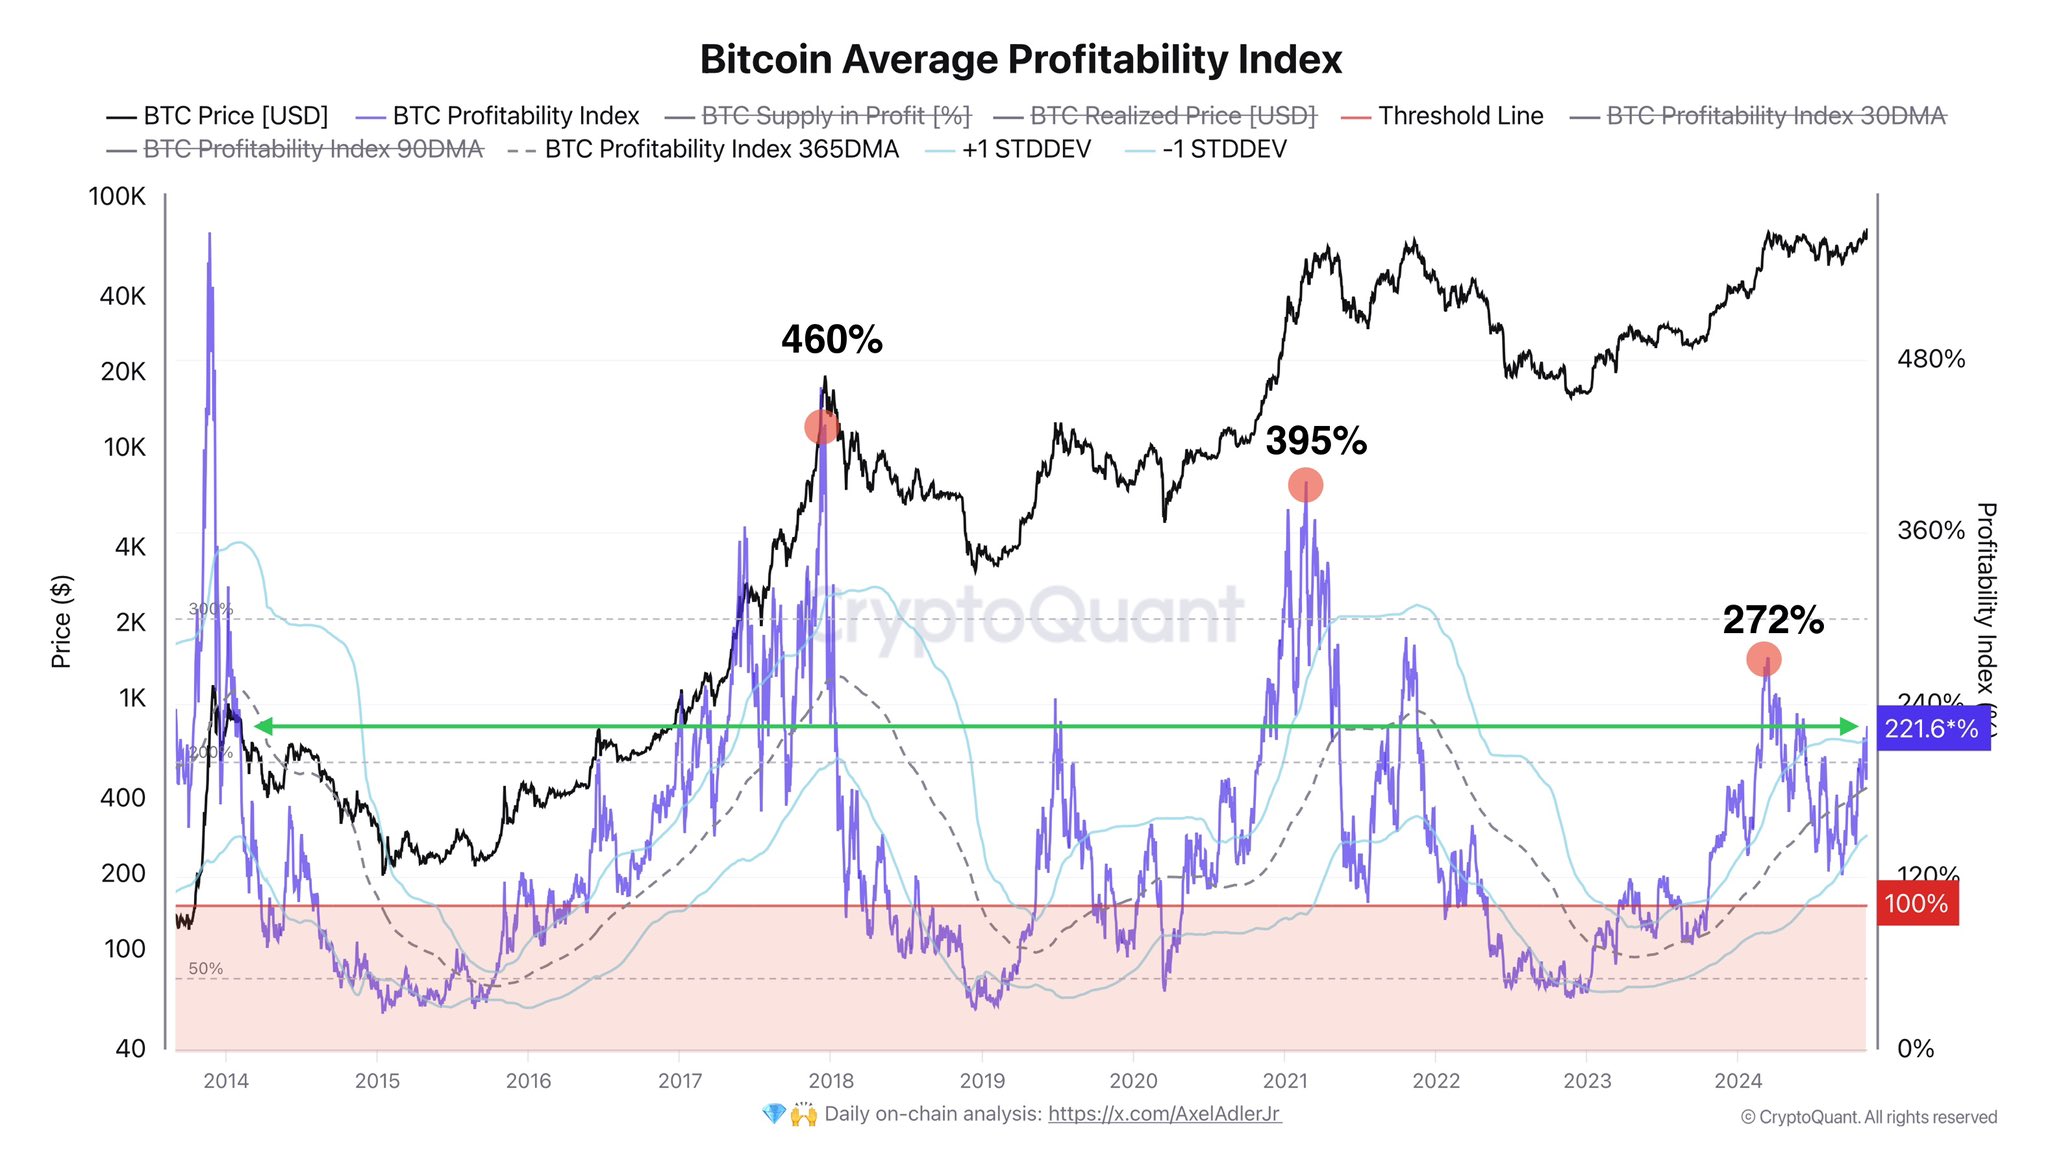
Research by planB suggests that Bitcoin’s 200-week moving average is growing by 5 percent per month, after a long hiatus. The chart showed Bitcoin’s progress over the years, with a dip in the 200 WMA staying prominent. The 200-week moving average aims to show market atmosphere/trend and whether Bitcoin’s next steps will be in the bear’s realm or the bull’s. Some users in the Bitcoin ecosystem further speculate whether there was a market frenzy coming up, one where the “raging bulls might take over”.
At press time, Bitcoin was trading at $7829, with a total market cap of $138.99 billion. The king coin held a 24-hour market volume of $17.5 billion, which was coming under pressure from the bear as the market was on the verge of a slight downturn.
The Moving Average Convergence Divergence [MACD] also showed a sustained bullish turn for Bitcoin, with the signal line and the MACD line undergoing a bullish crossover. However, that pattern changed after the arrival of the bear in the market.
While the 200 WMA showed positive signs, other parameters like the support and resistance of the cryptocurrency were stuck on a rollercoaster as the coin inched towards breaching the $8000 mark again. This fact was further evidenced by Josh Rager, an analyst and member of the advisory team at Token Bacon, who stated,
“$BTC Update Support that flipped to resistance, flipped back to support Still in a channel and need to break above $8200 – closing there would likely lead up to $8700+ $7900 to $8000 has been the most accumulated price range since May 13th”
The post Bitcoin’s 200-week moving average scales new heights as coin inches closer to $8000 appeared first on AMBCrypto.
origin »Bitcoin price in Telegram @btc_price_every_hour
Bitcoin (BTC) на Currencies.ru
|
|


