2020-11-27 13:41 |
Bitcoin (BTC) reached a high of $19,490 on Nov. 25 but decreased significantly the next day dropping below $17,000.
It is possible that this is the beginning of a corrective movement that could take the Bitcoin price towards the support areas outlined below.
In this article, the length of the waves will be referred to as:
Cycle Wave – Blue Wave – White Sub-wave – Orange Minor sub-wave – RedFor the previous Bitcoin wave count article from last week, click here.
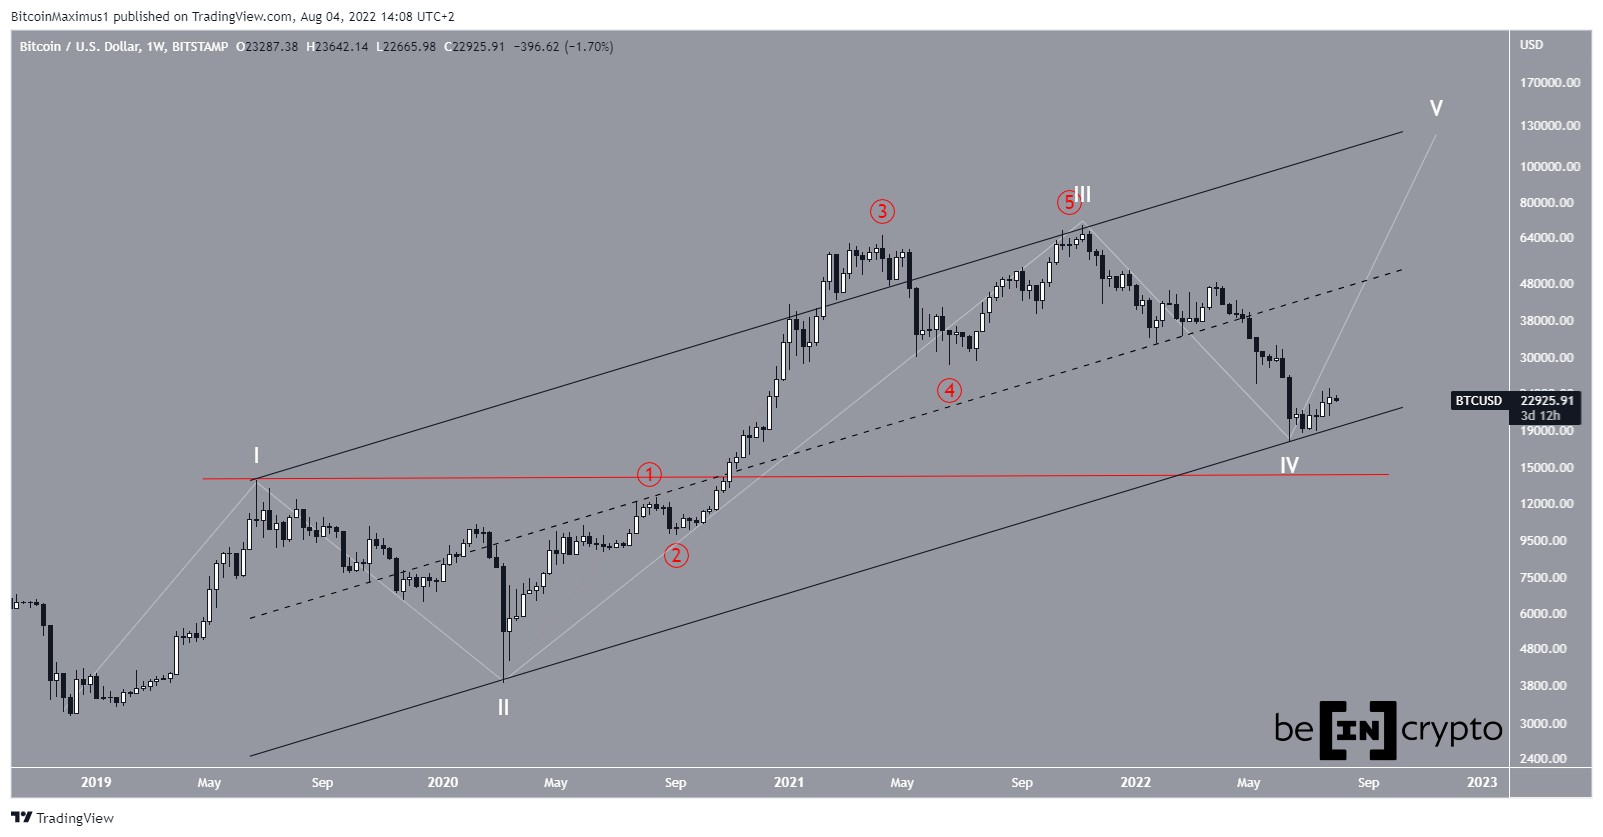
Bitcoin Long-Term CountSince reaching a low of $3,122 on Dec 15, 2018, the BTC price seems to be in a long-term A-B-C corrective structure (shown in blue below). If so, the price has possibly just completed the C wave and has now begun a prolonged downward move.
The C cycle wave is composed of a bullish impulse (white), which seems to show a completed five-wave formation. The top for this move is found using different Fib retracements — the projection of waves 1-3 to the bottom of 4 (blue) and the external 3.61 Fib retracement of wave 4 (black).
If the price has indeed begun a corrective move, the three most likely levels to provide support would be found at $13,230, $11,300, and $9,383 (0.382, 0.5, and 0.618 Fib retracement levels respectively).
However, it is worth noting that the upward move has been going on for 255 days, so if the correction occurs, we would expect it to continue for at least 1/3 of that time before the local bottom is reached.
BTC Chart By TradingView Short-Term CountCryptocurrency trader @TheTradingHubb stated that this is the first time that BTC has reached a close below the parabolic ascending support line, and suggested that BTC may have begun its correction.
Source: TwitterA closer look at wave 5 reveals a completed 5 sub-wave formation (shown in orange below), which would mean that the upward move has indeed ended.
Furthermore, the rate of decrease during the drop also resembles the beginning of a new downward movement.
BTC Chart By TradingViewAn even closer look at the movement shows five completed minor sub-waves (red), in which minor sub-wave 4 was a triangle.
Therefore, it is possible that BTC has begun a downward trend and will decrease towards the support levels outlined in the first section.
BTC Chart By TradingView Future MovementAssuming that BTC has begun a downward movement, it likely has just completed the third minor sub-wave of a bearish impulse (red), which has become extended.
If the count is accurate, BTC would be expected to decrease once more after completing minor sub-wave 4, before eventually dropping to the $15,900 area.
BTC Chart By TradingViewHowever, this decrease is likely to be a part of a longer-term sub-wave A (shown in orange below), after which the price could decrease even further.
The even more bearish scenario would suggest that this is still the first wave of a larger degree, but that is still too early to call.
BTC Chart By TradingView ConclusionTo conclude, it is possible that Bitcoin has begun a corrective movement and will eventually decrease all the way back to $13,230.
For BeInCrypto’s previous Bitcoin analysis, click here!
Disclaimer: Cryptocurrency trading carries a high level of risk and may not be suitable for all investors. The views expressed in this article do not reflect those of BeInCrypto
The post Bitcoin Wave Count Suggests a Top has Been Reached appeared first on BeInCrypto.
origin »Bitcoin price in Telegram @btc_price_every_hour
Bitcoin (BTC) на Currencies.ru
|
|


