2020-8-20 07:08 |
Bitcoin price settled below the $12,000 support level against the US Dollar. BTC is currently consolidating above the $11,650 and $11,500 support levels, below which it could nosedive.
Bitcoin remained in a short-term bearish zone and it settled below the $12,000 region. The price is currently consolidating losses above the $11,650 and $11,550 support levels. There is a key bearish trend line forming with resistance near $11,880 on the hourly chart of the BTC/USD pair (data feed from Kraken). The pair must stay above the $11,500 support zone to start a fresh increase in the near term. Bitcoin Price Showing Bearish SignsAfter bitcoin started a downside correction below $12,000, the bulls slowly lost control against the US Dollar. BTC even settled well below the $12,000 region and the 100 hourly simple moving average.
The bears were able to push the price below the $11,650 support zone. However, the price is still trading nicely above the $11,550 and $11,500 support levels. A low is formed near $11,581 and the price is currently correcting higher.
It recovered above the $11,700 level, but the $11,800 level is acting as a resistance. The 23.6% Fib retracement level of the recent drop from the $12,490 high to $11,581 low is also near the $11,795 level.
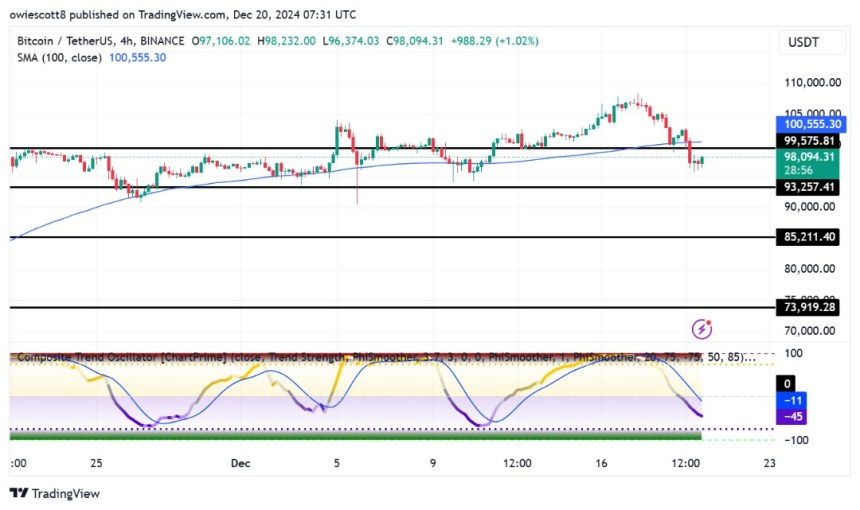
Bitcoin price trades below $12,000. Source: TradingView.comMore importantly, there is a key bearish trend line forming with resistance near $11,880 on the hourly chart of the BTC/USD pair. If there is an upside break above the trend line resistance, the price could continue to recover towards the $11,950 level or the 100 hourly SMA.
The next key resistance is near the $12,000 and $12,050 levels. The 50% Fib retracement level of the recent drop from the $12,490 high to $11,581 low is also near the $12,035 level.
On the downside, the $11,650 and $11,550 support levels are important. If there is a clear downside break and close below $11,500, the price might slide sharply towards the $11,200 and $11,000 levels in the near term.
Fresh Upward Move in BTC?If bitcoin breaks the trend line resistance, it might retest $12,000. To move into a positive zone and start a fresh increase, the price must settle above the $12,000 and $12,050 levels.
The next major resistance is near the $12,150 level, above which the price could easily rise towards the main $12,500 resistance.
Technical indicators:
Hourly MACD – The MACD is slowly moving into the bullish zone.
Hourly RSI (Relative Strength Index) – The RSI for BTC/USD is now well below the 50 level.
Major Support Levels – $11,650, followed by $11,500.
Major Resistance Levels – $11,880, $12,000 and $12,050.
origin »Bitcoin price in Telegram @btc_price_every_hour
Bitcoin (BTC) на Currencies.ru
|
|