![Bitcoin Price Takes Aim at $7.4K Resistance — $7.6K by Monthly Close?](http://images.cointelegraph.com/images/528_aHR0cHM6Ly9zMy5jb2ludGVsZWdyYXBoLmNvbS9zdG9yYWdlL3VwbG9hZHMvdmlldy8yY2JlOTNkN2E4N2FmZGZiYmQ3NjE2OThkZDAyZGQyNi5qcGc=.jpg)
2019-12-28 09:29 |
Bitcoin price appears set to retest the $7.4K resistance but will the digital asset take a shot at the more important $7.6K resistance before the weekly and monthly close?
origin »Bitcoin (BTC) на Currencies.ru
![]() ![]() ![]() ![]() ![]() ![]() |
2019-12-28 09:29 |
Bitcoin price appears set to retest the $7.4K resistance but will the digital asset take a shot at the more important $7.6K resistance before the weekly and monthly close?
origin »
![]() ![]() ![]() ![]() ![]() ![]() |
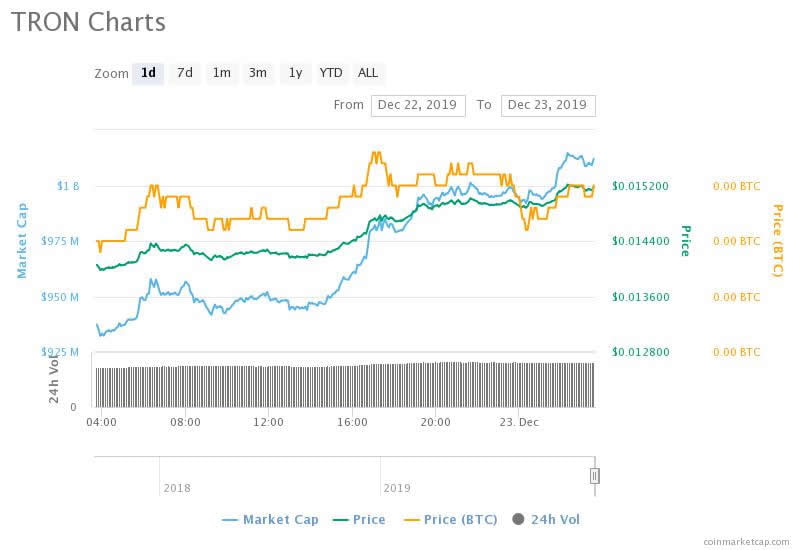
All eyes have been on Bitcoin over the past few hours as it tapped a two week high and monthly resistance. BTC is not the top performing crypto asset at the moment as that accolade goes to Tron. Tron Adds 9% in Crypto Surge Bitcoin dominance may have hit a three month high over 71%.
2019-12-23 10:00 | |
![]() ![]() ![]() ![]() ![]() ![]() |
Bitcoin cash price is showing recovery signs from the $170 monthly low against the US Dollar. The price is currently consolidating above the $180 and $182 support levels. There is a key bearish trend line forming with resistance near $190 on the hourly chart of the BCH/USD pair (data feed from Kraken).
2019-12-19 12:00 | |
![]() ![]() ![]() ![]() ![]() ![]() |
Bitcoin price is showing positive signs above the $7,400 resistance area against the US Dollar. The price is likely to clear the $7,560 and $7,600 resistances to continue higher. There is a major bullish trend line forming with support near $7,490 on the hourly chart of the BTC/USD pair (data feed from Kraken).
2019-12-9 09:00 | |
![]() ![]() ![]() ![]() ![]() ![]() |
Bitcoin price is back to where it started and trading below the $7,380 resistance against the US Dollar. The price is currently under pressure, but it is likely to hold the $7,100 support area. There is a short term contracting triangle forming with resistance near $7,220 on the hourly chart of the BTC/USD pair (data.
2019-12-5 09:00 | |
![]() ![]() ![]() ![]() ![]() ![]() |
Ripple price is currently correcting from the monthly low of $0.2003. XRP to USD is now trading above $0.2150 and it is facing a lot of strong hurdles near $0.2250 and $0.2350. Key Takeaways: XRP/USD Ripple price is trading with a short term bullish bias above the $0.2150 level against the US Dollar. XRP/USD climbed […]
2019-11-27 16:57 | |
![]() ![]() ![]() ![]() ![]() ![]() |
Ripple price is currently correcting from the new monthly low of $0. 2005 against the US dollar. The price might correct further higher, but the $0. 2270 resistance is a crucial hurdle for buyers.
2019-11-26 07:28 | |
![]() ![]() ![]() ![]() ![]() ![]() |
Bitcoin price is currently declining below the $8,600 support area against the US Dollar. A new monthly low was formed near $8,457 and the price is currently correcting higher. There is a key declining channel forming with resistance near $8,710 on the hourly chart of the BTC/USD pair (data feed from Kraken).
2019-11-15 09:00 | |
![]() ![]() ![]() ![]() ![]() ![]() |
Bitcoin price is trading in a downtrend below $8,800 and $9,000 against the US Dollar. The price is currently declining and it seems to be struggling near the $8,840 level. Yesterday’s major bearish trend line is active with resistance near $8,920 on the hourly chart of the BTC/USD pair (data feed from Kraken).
2019-11-13 09:00 | |
![]() ![]() ![]() ![]() ![]() ![]() |
After a brief attempt to climb above its strong resistance level at $0. 30 earlier this week, XRP faced a strong and swift rejection and is now moving down towards its monthly lows that currently sit around $0.
2019-11-9 02:00 | |
![]() ![]() ![]() ![]() ![]() ![]() |
Bitcoin price is down more than 8% and it dived below $7,500 against the US Dollar. The price is currently correcting higher after trading to a new monthly low near $7,300 There are two connecting bearish trend lines forming with resistance near $7,450 and $7,660 on the hourly chart of the BTC/USD pair (data feed.
2019-10-24 09:00 | |
![]() ![]() ![]() ![]() ![]() ![]() |
Ripple price started a fresh increase and it surged above $0. 3000 against the US dollar. The price is currently correcting higher after trading to a new monthly high near $0. 3040. Earlier, there was a break above a declining channel with resistance near $0.
2019-10-18 07:08 | |
![]() ![]() ![]() ![]() ![]() ![]() |
ETH price surged higher and broke the key $185 resistance against the US Dollar. The price is currently correcting lower after setting a new monthly high near the $196 level. There is a short term breakout pattern forming with support near $191 on the hourly chart of ETH/USD (data feed via Kraken).
2019-10-10 06:08 | |
![]() ![]() ![]() ![]() ![]() ![]() |
Bitcoin price is declining and it recently traded to a new monthly low at $7,661 against the US Dollar. The price is trading in a downtrend and it is likely to test the $7,500 or $7,200 level in the near term.
2019-9-30 09:00 | |
![]() ![]() ![]() ![]() ![]() ![]() |
ETH price surged higher above the $200 and $210 resistance levels against the US Dollar. The price is currently correcting lower after posting a new monthly high near $225. There was a break below a major bullish trend line with support near $216 on the 4-hours chart of ETH/USD (data feed via Kraken).
2019-9-22 07:08 | |
![]() ![]() ![]() ![]() ![]() ![]() |
There was a steady rise in bitcoin price above the $10,500 resistance against the US Dollar. The price is currently correcting lower after it traded to a new monthly high close to $11,000. There is a key bullish trend line forming with support near $10,200 on the 4-hours chart of the BTC/USD pair (data feed.
2019-9-8 07:08 | |
![]() ![]() ![]() ![]() ![]() ![]() |
After seeing a retest of macro resistance at a $10,750 price, the bitcoin market saw a strong pullback and is testing a monthly supply level of $10,300. The post Monthly Macro Support Tested With Impulsive Move appeared first on Bitcoin Magazine.
2019-9-7 00:22 | |
![]() ![]() ![]() ![]() ![]() ![]() |
This weekend, Bitcoin price closed its second consecutive monthly red candle in a row, as bulls failed to push the price of the leading crypto asset by market cap through resistance to retest its recent local high.
2019-9-3 02:00 | |
![]() ![]() ![]() ![]() ![]() ![]() |
Throughout all of 2019, Bitcoin price has been on a steady ascent. For the greater portion of the year, Bitcoin appeared to be unstoppable and broke through resistance after resistance, even as the altcoin market bled out.
2019-8-31 21:00 | |
![]() ![]() ![]() ![]() ![]() ![]() |
Ripple price is following a bearish path and it recently broke the $0. 2700 support against the US dollar. Bitcoin price is down around 8% and it settled below the key $10,000 support area. There is a major declining channel forming with resistance near $0.
2019-8-22 07:08 | |
![]() ![]() ![]() ![]() ![]() ![]() |
ETH price declined to a new monthly low at $173 and recently recovered against the US Dollar. There was a break above the $180 and $182 resistance levels. This week’s followed major bearish trend line is in place with resistance near $202 on the hourly chart of ETH/USD (data feed via Kraken).
2019-8-16 06:08 | |
![]() ![]() ![]() ![]() ![]() ![]() |
Ripple price started an upside correction after trading to a new monthly low at $0. 2897 against the US dollar. The price is trading above the $0. 3000 level, with a few positive signs. There was a break above a crucial bearish trend line with resistance near $0.
2019-8-12 07:08 | |
![]() ![]() ![]() ![]() ![]() ![]() |
ETH price traded to a new monthly low near $190 and later corrected lower against the US Dollar. The price corrected above the $200 resistance level, but upsides could face hurdles near $220 and $225.
2019-7-18 06:08 | |
![]() ![]() ![]() ![]() ![]() ![]() |
Ripple price failed to climb above the $0. 3230 resistance and resumed decline against the US dollar. The price broke the $0. 3000 support level and traded to a new monthly low at $0. 2835. This week’s followed bearish trend line is active with resistance at $0.
2019-7-17 07:08 | |
![]() ![]() ![]() ![]() ![]() ![]() |
Ripple price broke the key $0. 3200 support level to extend losses against the US dollar. The price even spiked below the $0. 3000 support area and traded to a new monthly low at $0. 2955. There is a major bearish trend line forming with resistance at $0.
2019-7-15 07:08 | |
![]() ![]() ![]() ![]() ![]() ![]() |
Ripple price traded to a new monthly low at $0. 3810 and corrected higher support against the US dollar. The price is struggling to gain bullish momentum and it is still trading well below $0. 4275.
2019-7-3 07:08 | |
![]() ![]() ![]() ![]() ![]() ![]() |
ETH price declined to a new monthly at $271 and recently recovered against the US Dollar. There was a sharp increase above the $280 and $290 resistance levels in the past two sessions. There was a break above a major bearish trend line with resistance near $286 on the hourly chart of ETH/USD (data feed.
2019-7-3 06:08 | |
![]() ![]() ![]() ![]() ![]() ![]() |
Ripple price climbed higher sharply and broke the key $0. 4500 resistance area against the US dollar. The price traded to a new monthly high at $0. 4631 and recently started a downside correction.
2019-6-18 07:08 | |
![]() ![]() ![]() ![]() ![]() ![]() |
Summary:Although we saw a strong sell off yesterday, the bullish market structure has yet to be violated. The weekly support has been confirmed for the time being and our parabolic advance is still intact.
2019-6-1 23:51 | |
![]() ![]() ![]() ![]() ![]() ![]() |
Summary:Bitcoin is currently perched between a well-defined band of prices outlined on both the weekly and monthly timeframes. As we float between the weekly/monthly horizontals, volume is beginning to diminish on both the supply and the demand sides.
2019-5-30 23:11 | |
![]() ![]() ![]() ![]() ![]() ![]() |
Summary:The bitcoin market is seeing some pullback as the monthly and weekly resistance level has proven to be a tough level to crack. On the daily level we can see a couple of attempts to break the level, but ultimately this was matched with strong selling pressure.
2019-5-24 23:46 | |
![]() ![]() ![]() ![]() ![]() ![]() |
Once BTC breaks above weekly and monthly resistance, it’s time for bulls onslaught But higher probability of BTC getting rejected here Since Bitcoin flash crashed to roughly around $6,200 from $8,300 and then surging to $7,000 level just as fast.
2019-5-21 18:58 | |
![]() ![]() ![]() ![]() ![]() ![]() |
As Bitcoin price nears closer to important resistance at $6,000, it’s clear that the leading cryptocurrency by market cap is at an inflection point, and where it goes next could set the tone for the following months to years.
2019-5-8 23:00 | |
![]() ![]() ![]() ![]() ![]() ![]() |
The bitcoin market’s bullish bias is looking stronger than other altcoins, according to Josh Rager. The cryptocurrency analyst said Wednesday that bitcoin was among the only crypto assets that managed to jump above a significant resistance level on monthly charts.
2019-5-2 15:53 | |
![]() ![]() ![]() ![]() ![]() ![]() |
At the start of April, Bitcoin price broke through resistance at $4,200, triggering a massive rally across the crypto market and a cascading effect of trader’s stops being hit, creating an hour-long price spike of nearly $1,000 per BTC.
2019-5-1 23:00 | |
![]() ![]() ![]() ![]() ![]() ![]() |
Bitcoin scaled an important price resistance with near 30 percent gains in April, solidifying the long-term bull breakout witnessed a month ago.
2019-5-1 14:10 | |
![]() ![]() ![]() ![]() ![]() ![]() |
After failing to overcome resistance at $100 during price increases three weeks ago, Litecoin continued its decline last week. The price has dropped to a level of support at $75 which is an important level on the longer-term monthly time frame.
2019-4-23 12:34 | |
![]() ![]() ![]() ![]() ![]() ![]() |
Bitcoin price settled above the $5,160 resistance and climbed above $5,250 against the US Dollar. The price traded towards the $5,300 resistance and it is currently consolidating gains. There is a key ascending channel in place with support at $5,230 on the hourly chart of the BTC/USD pair (data feed from Kraken).
2019-4-18 09:30 | |
![]() ![]() ![]() ![]() ![]() ![]() |
Summary:Buying pressure continues as the bitcoin market holds above the macro, bearish trendline and the monthly resistance level. There was a small amount of selling pressure but it was absorbed by eager bulls.
2019-4-6 22:35 | |
![]() ![]() ![]() ![]() ![]() ![]() |
Introducing our first video price analysis by Bitcoin Schmitcoin. Summary:Bitcoin broke out of a massive consolidation pattern known as an “Adam and Eve” double bottom.
2019-4-3 00:57 | |
![]() ![]() ![]() ![]() ![]() ![]() |
Bitcoin turned green and jumped $4,100 by closing at $4,153. But with the 24-hours loss of 0. 16 percent, the top cryptocurrency dropped and has been trading at $4,089, at the time of writing, as per Coinmarketcap.
2019-3-30 18:36 | |
![]() ![]() ![]() ![]() ![]() ![]() |
Bitcoin price is gaining bullish momentum above the $4,000 resistance area against the US Dollar. The price is trading near monthly highs and it could accelerate above $4,050 and $4,080. There is a key connecting bullish trend line formed with support at $3,985 on the hourly chart of the BTC/USD pair (data feed from Kraken).
2019-3-21 09:30 | |
![]() ![]() ![]() ![]() ![]() ![]() |
ETH price corrected lower and tested the $136-137 support area against the US Dollar. The price is currently recovering and it may continue to rise above $141 and $144 in the near term. This was a break above a key contracting triangle with resistance near $139 on the hourly chart of ETH/USD (data feed via.
2019-3-18 07:08 | |
![]() ![]() ![]() ![]() ![]() ![]() |
Bitcoin price traded above the $3,940 level recently before correcting lower against the US Dollar. The price is following a solid bullish path and buyers seem to be in control above $3,800. There is a short term declining channel in place with resistance at $3,900 on the hourly chart of the BTC/USD pair (data feed.
2019-3-11 09:38 | |
![]() ![]() ![]() ![]() ![]() ![]() |
Bitcoin has failed to overcome a number of key levels after the significant price decrease which took place yesterday. Price had been meeting resistance at a number of points including the 50 EMA on the monthly, the 200 EMA on the weekly, and the point of the former high.
2019-2-25 15:49 | |
![]() ![]() ![]() ![]() ![]() ![]() |
Over the past couple of weeks Bitcoin (BTC) has seen relatively positive trading action, surging from monthly lows of under $3,400 to highs of $4,000, from which it has only dropped slightly. Importantly, $4,000 has proven to be a strong level of resistance for Bitcoin, and analysts have mixed opinions on where the cryptocurrency is.
2019-2-22 03:00 | |
![]() ![]() ![]() ![]() ![]() ![]() |
On Sunday Ethereum price ramped up an amazing 12%+ upside move. Does this mean Feb 5th drop to $100 was the 2019 bottom for Ethereum? Ethereum Price: Market Overview On Sunday Ethereum (ETH) shifted into beast mode and steamrolled past the $125 and $130 resistance levels and onto new monthly highs.
2019-2-18 10:00 | |
![]() ![]() ![]() ![]() ![]() ![]() |
Bitcoin price traded to a new monthly low towards $3,340 and later recovered against the US Dollar. Yesterday’s highlighted key bearish trend line is intact with resistance at $3,450 on the hourly chart of the BTC/USD pair (data feed from Kraken).
2019-1-30 09:45 | |
![]() ![]() ![]() ![]() ![]() ![]() |
Last week, after a devastating move that shook the market violently up and down for a 7% move in just a few short minutes, bitcoin saw a major sign of strength as it proceeded to have a slow, but steady markup where it managed to establish a local high in the $6,800s:Figure 1: BTC-USD, Hourly Candles, Shakeout Prior to MarkupThis shakeout forced the market to temporarily establish a new monthly low in what could be argued to be a stop-hunt prior to the move to the $6,800s.
2018-9-24 21:29 | |
![]() ![]() ![]() ![]() ![]() ![]() |
As Bitcoin price approaches the Monthly candle close after a volatile day yesterday, we take a look at what’s going on in the market. 4 Hour Chart Looking that the daily chart, after closing the previous week at $6,700, Bitcoin began a bullish start to the week, trading at highs of $7,125 breaking the linear resistance by Tuesday.
2018-8-31 16:00 | |
![]() ![]() ![]() ![]() ![]() ![]() |